This topic contains a solution. Click here to go to the answer
|
|
|

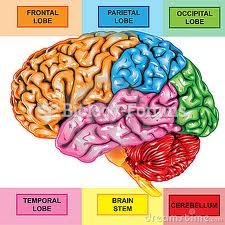 Lobes of the Brain
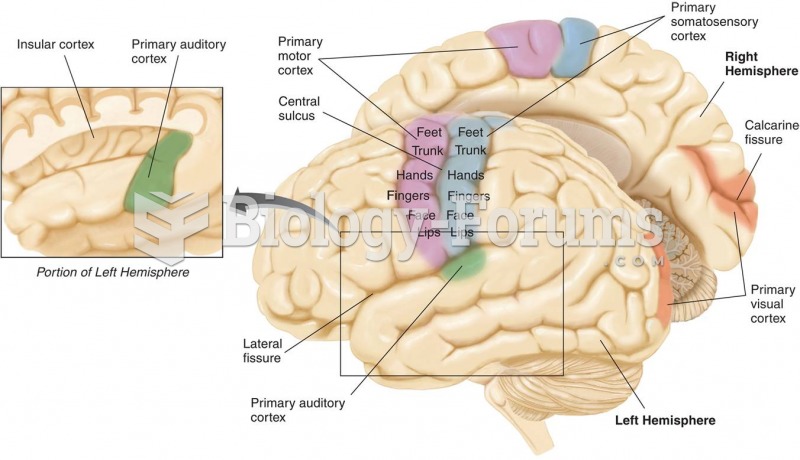 The Primary Sensory Regions of the Brain
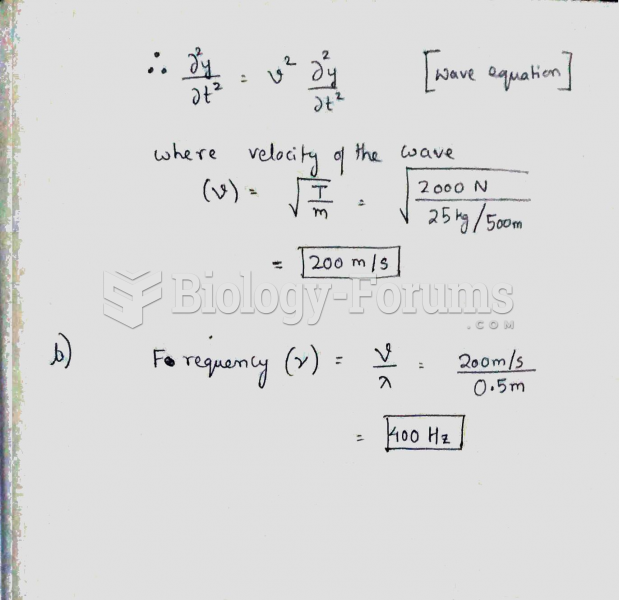 A wave whose wavelength is 0.500 m is traveling down a 500-m long wire whose total mass is 25 ...
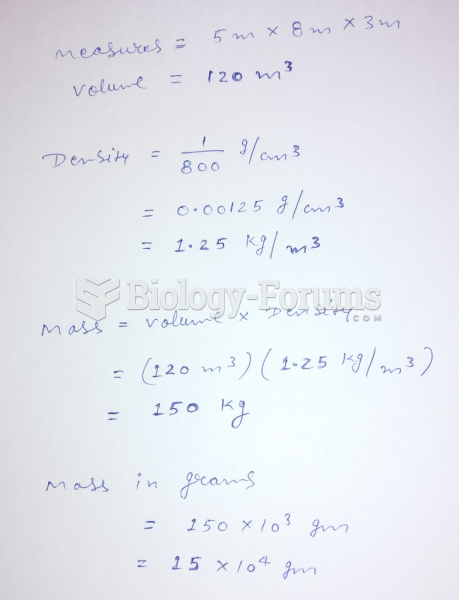 What is the mass of air in a room that measures 5.0 m 8.0 m 3.0 m? (The density of air is ...
 Mass spectrometry of a synthetic version of collagen peptide