This topic contains a solution. Click here to go to the answer
|
|
|

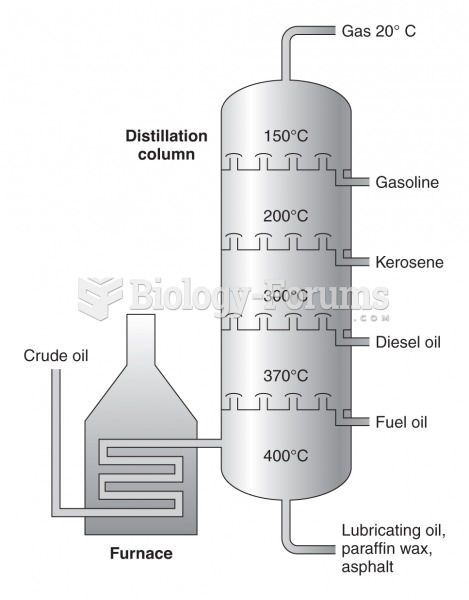 Simplified diagram of the fractional distillation process
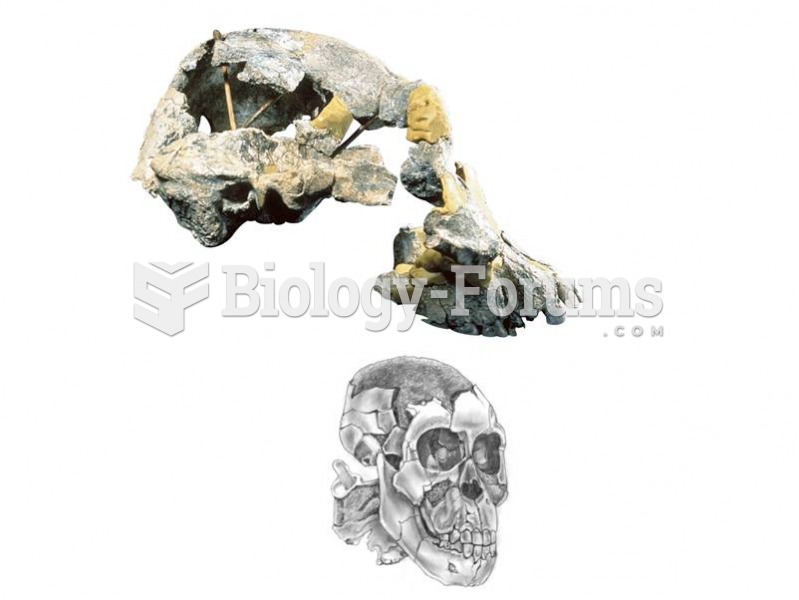 A complete cranium of Au. Afarensis from Hadar, Ethiopia, shows a prognathic face and a small brainc
 diagram
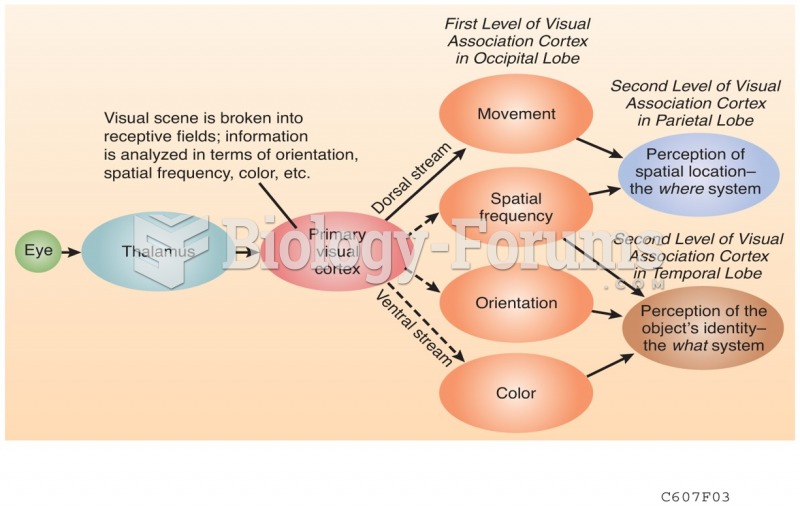 Schematic Diagram
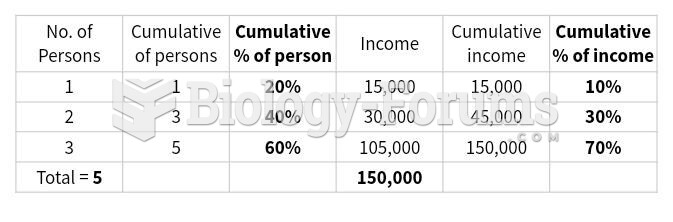 Construct a Lorenz curve that shows income distribution in this society.
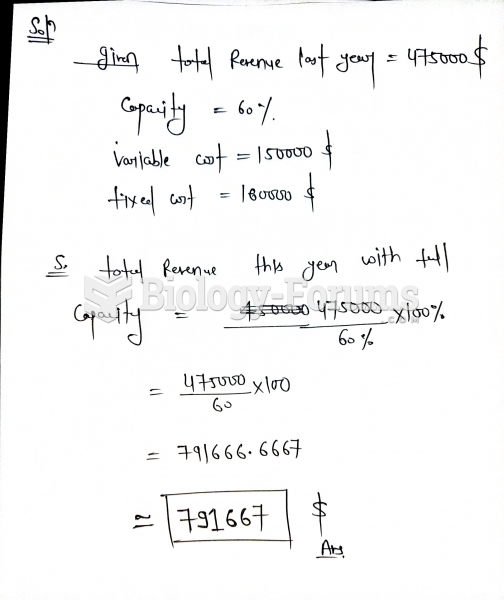 Last year, Terrific Copying had total revenue of $475 000, while operating at 60% of capacity. ...