This topic contains a solution. Click here to go to the answer
|
|
|

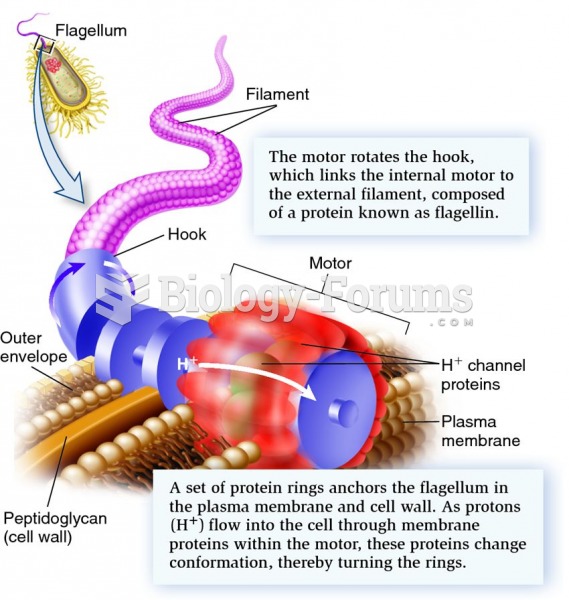 Diagram of a prokaryotic flagellum, showing filament, hook, and motor.
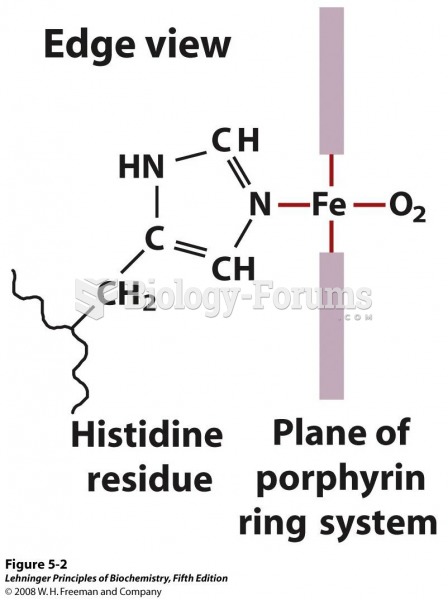 The heme group viewed from the side. This view shows the two coordination bonds to Fe2+
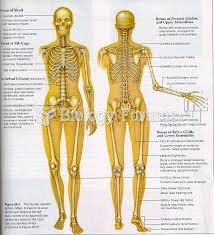 Human Skeleton Diagram
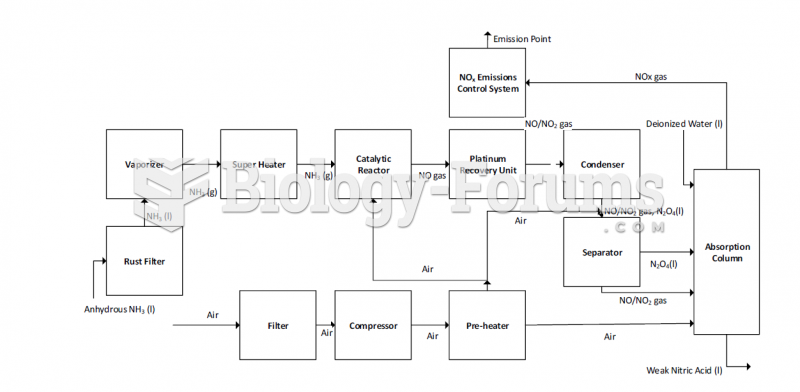 Block Diagram of a Dual-stage Pressure System for Dual-Stage Pressure Production of Nitric Acid Seme
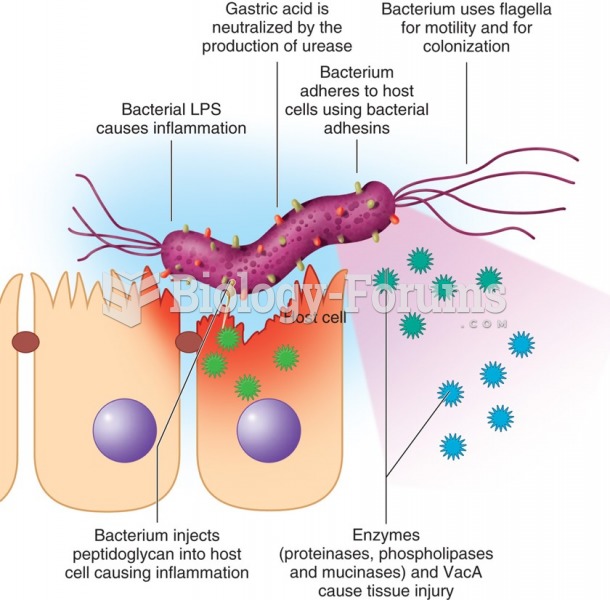 Schematic diagram of virulence factors of Helicobacter pylori.
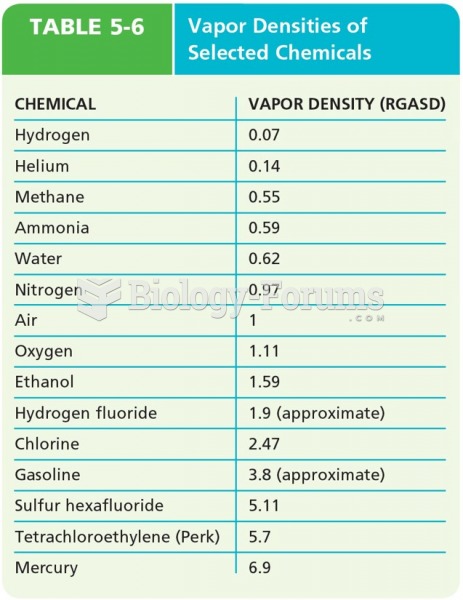 Vapor Densities of Selected Chemicals