This topic contains a solution. Click here to go to the answer
|
|
|

 Myopia (nearsightedness). In the uncorrected top figure, the image comes into focus in front of the
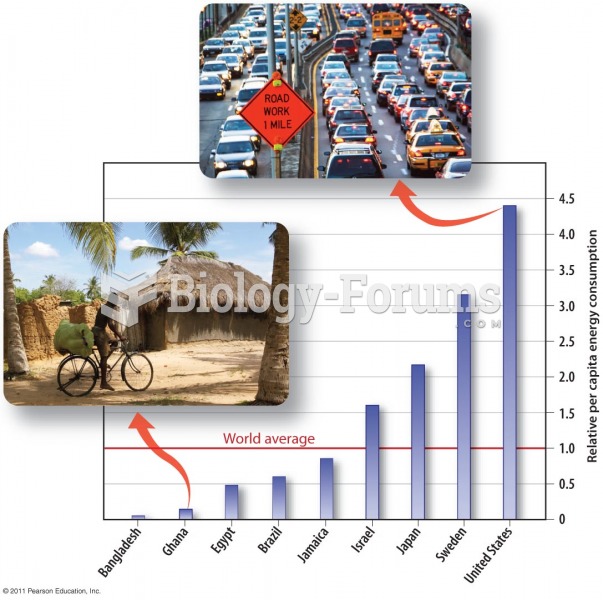 Relative Energy Consumption per Person for Selected Countries
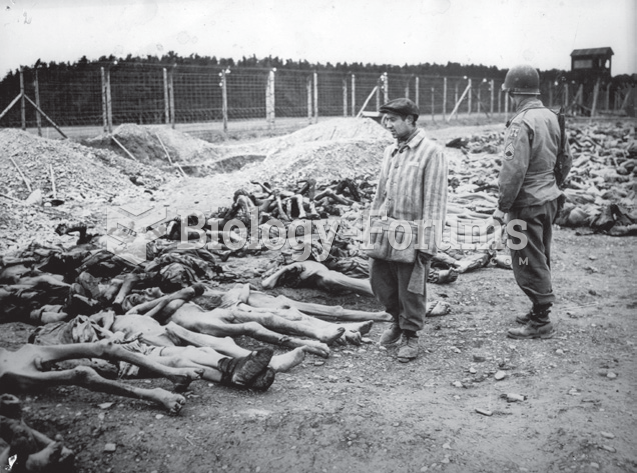 The reason I selected this photo is to illustrate how seriously we must take all preaching of hatred ...
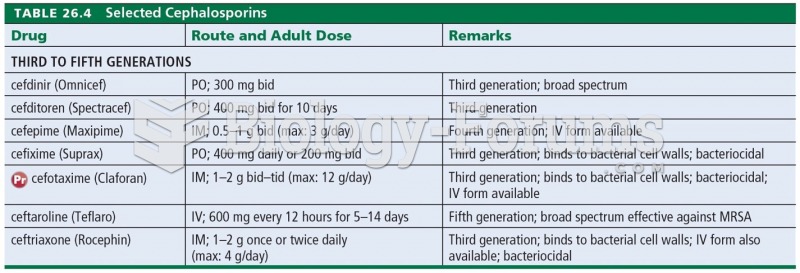 Selected Cephalosporins
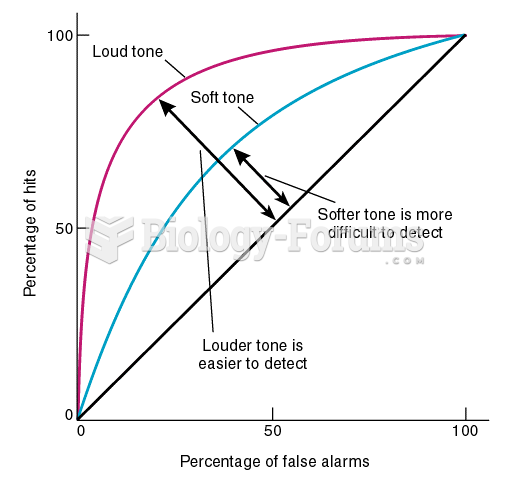 Two ROC Curves