This topic contains a solution. Click here to go to the answer
|
|
|

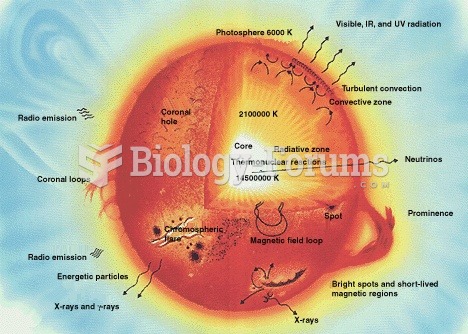 This diagram shows a cross-section of a solar-type star.
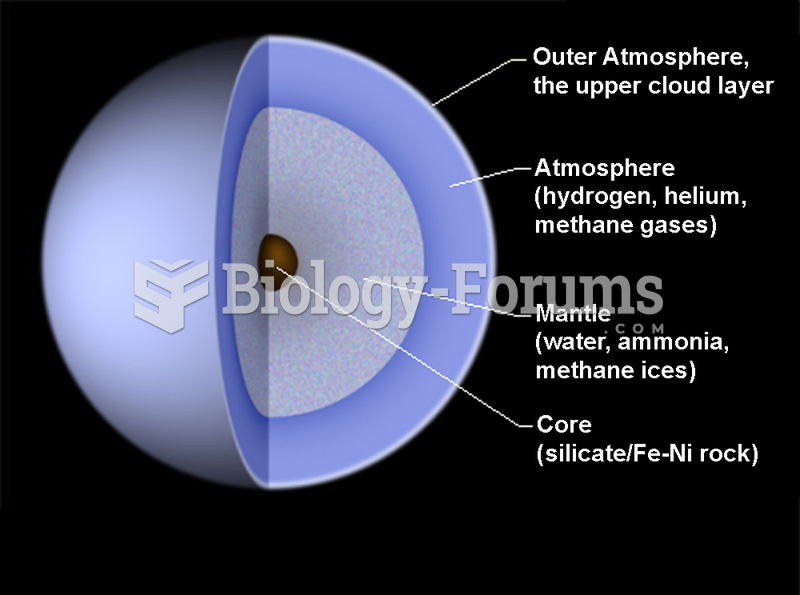 Diagram of the interior of Uranus
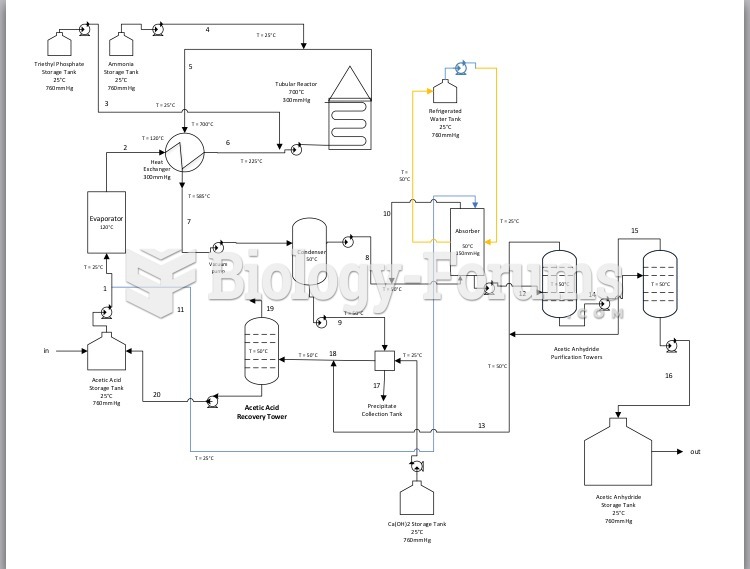 Process flow diagram for Acetic Anhydride Plant
 Monitoring shows that many forms of air pollution have decreased
 Management Information Systems: Managing the Digital Firm, 15th Edition
 Venn diagram representation of 17,067 medium and large clusters of protein