The diagram below shows the marginal costs of pollution abatement for two firms, Firm 1 and Firm 2.

FIGURE 17-5
Refer to Figure 17-5. Suppose Firm 1 and Firm 2 are each abating Q3 units of pollution. If the government imposed an emissions tax of $40 per unit of emissions,
◦ Firm 1 would increase abatement beyond Q
3 and Firm 2 would abate less than Q
3.
◦ each firm would abate to Q
3.
◦ Firm 2 would increase abatement beyond Q
3 and Firm 1 would abate less than Q
3.
◦ each firm would abate to the same level.
◦ the level of pollution would be optimal.

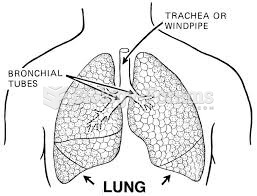 Human Lungs Diagram
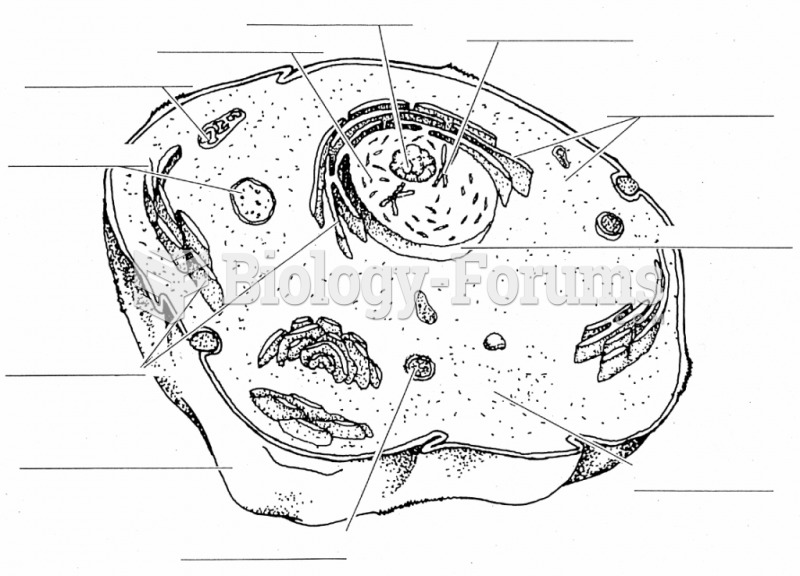 Blank cell diagram
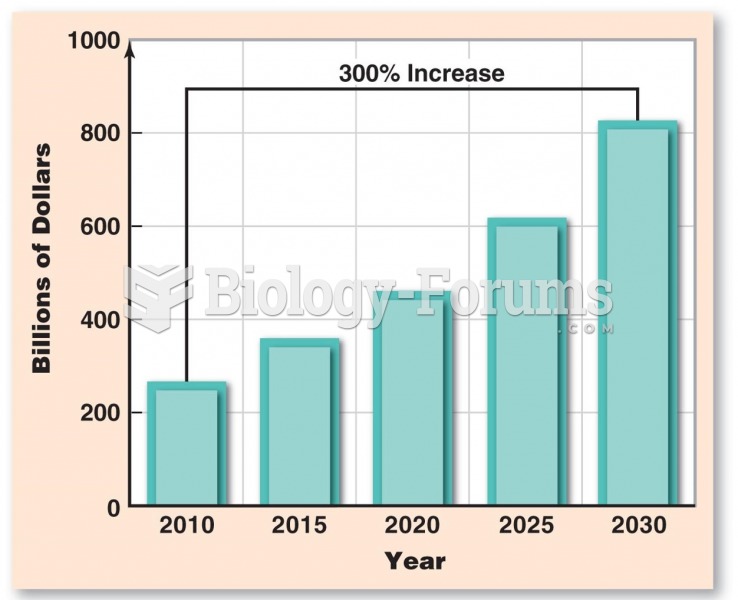 Economic Costs of CVD
 Schematic Diagram
 Lawn Fertilizer and Water Pollution