This topic contains a solution. Click here to go to the answer
|
|
|

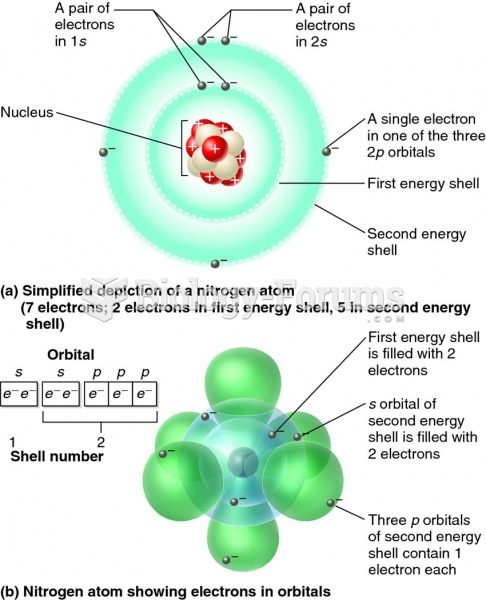 Diagrams showing the multiple energy shells and orbitals of a nitrogen atom
 Boundaries within landscapes created by human activity (background) and natural environmental gradie
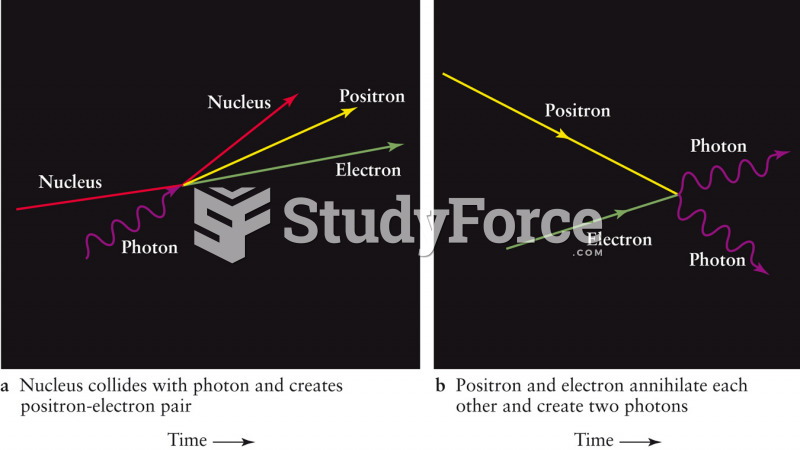 Pair Production and Annihilation
 Horizontal, sagittal, and coronal functional MRIs show areas of increased activity in the primary ...
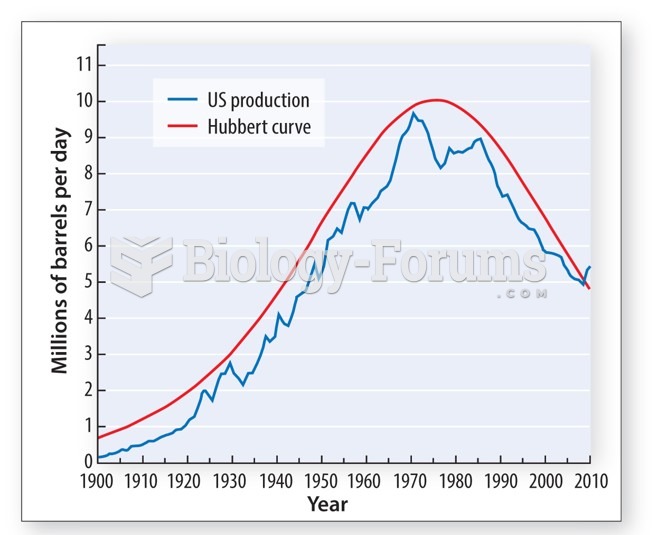 Conventional oil reserves have passed peak production
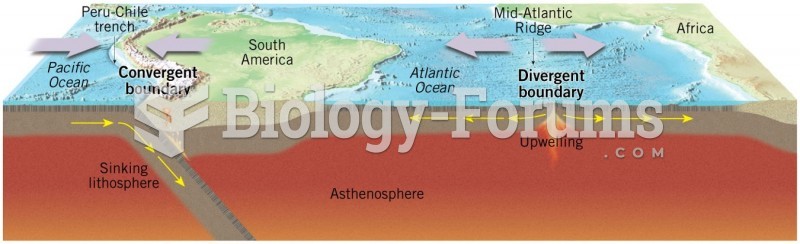 Convergent and Divergent Boundaries