This topic contains a solution. Click here to go to the answer
|
|
|

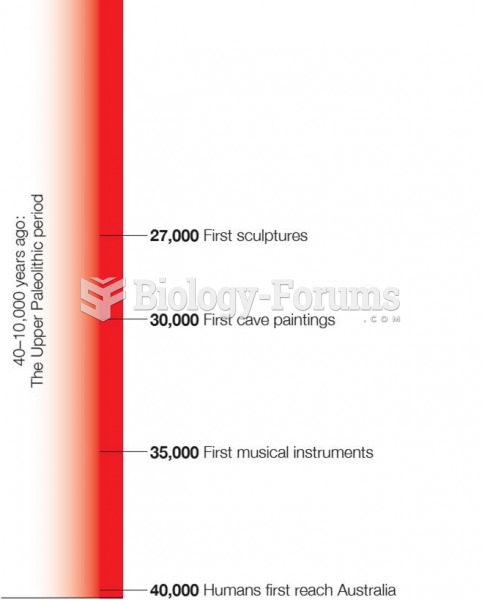 Time Line of Human History From Upper Paleolithic Period to the Present
 The first commercially successful typewriter, manufactured in quantity beginning in 1874, surely fue
 According to Kohlberg’s theory, only a few individuals, such as Martin Luther King, Jr. (left) and ...
 Older adulthood can be a time of independence and exploration as responsibilities diminish and the ...
 A Global Bloom: Cities With Over One Million Residents
 Disitive Time For Nuts