This topic contains a solution. Click here to go to the answer
|
|
|

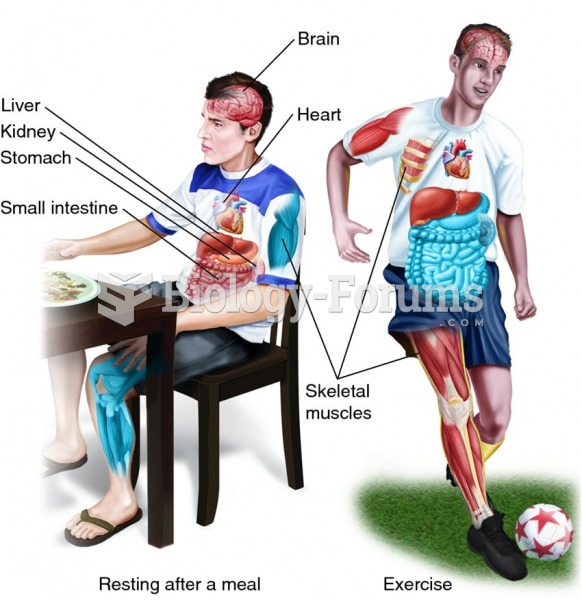 Changes in metabolic rate of selected structures in a mammal's body during different activities
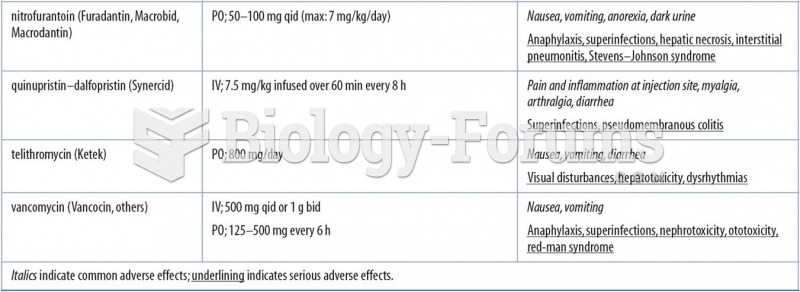 Selected Miscellaneous Antibacterials
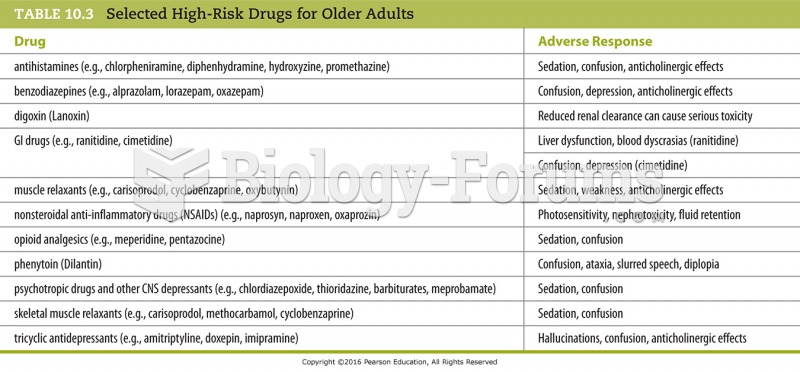 Selected High-Risk Drugs for Older Adults
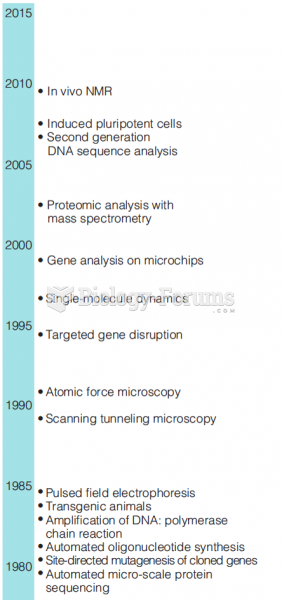 Recent history of biochemistry shown by the introduction of new techniques. (part 2)
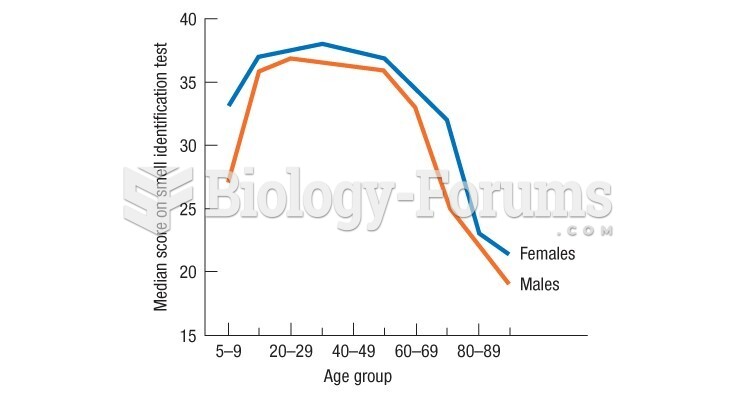 Doty's data show a very rapid drop in late adulthood in the ability to identify smells
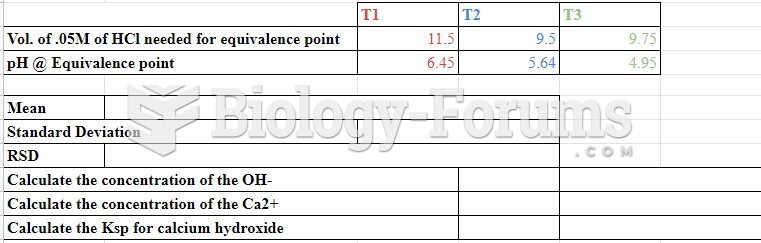 data
data