This topic contains a solution. Click here to go to the answer
|
|
|

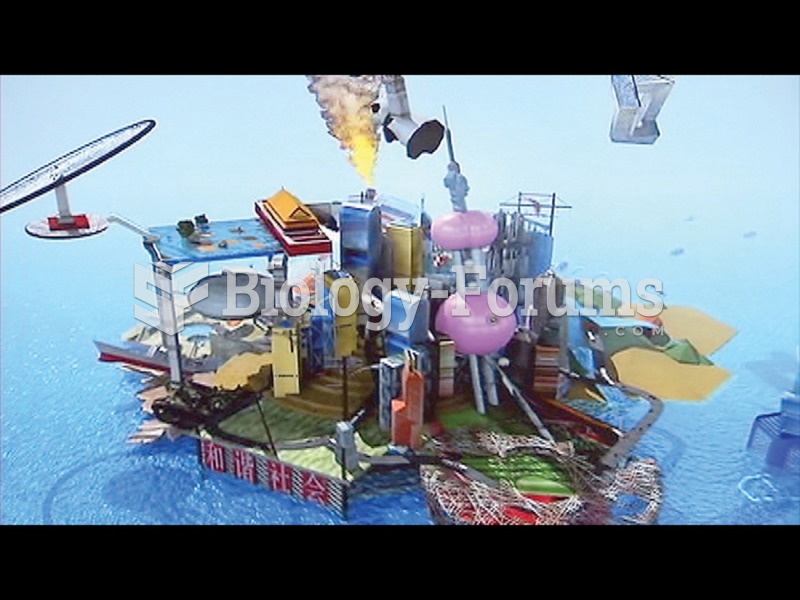 Cao Fei, RMB City, in Art in the Twenty-First Century, season 5 episode, "Fantasy".
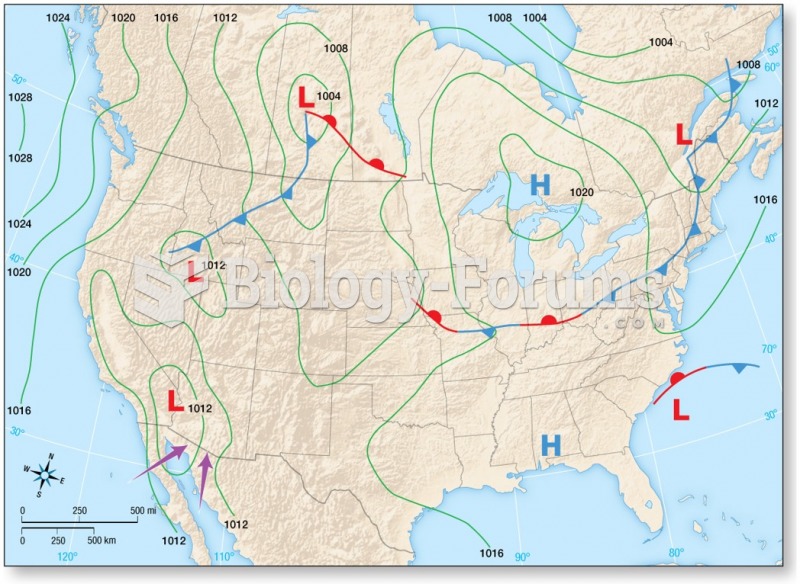 Major Wind Systems: Monsoons
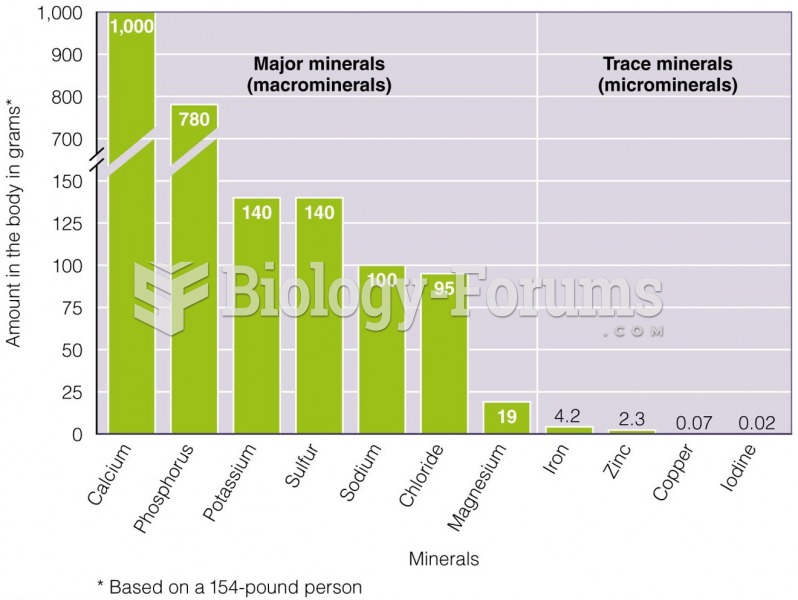 The Amounts of the Different Minerals in Your Body The major minerals are present in larger amounts
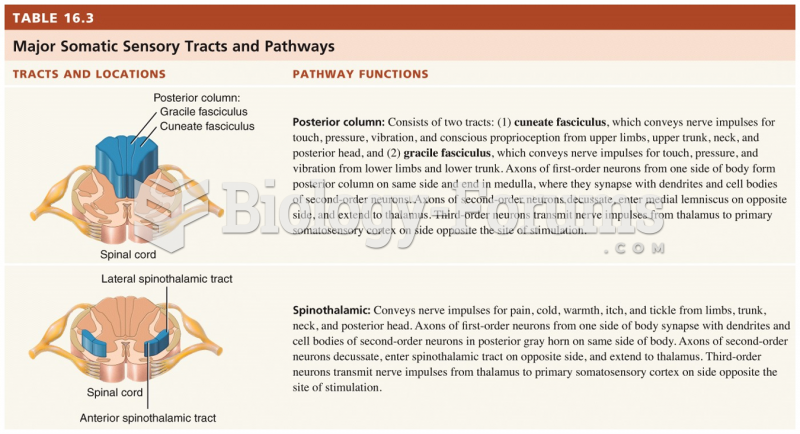 Major Somatic Sensory Tracts and Pathways
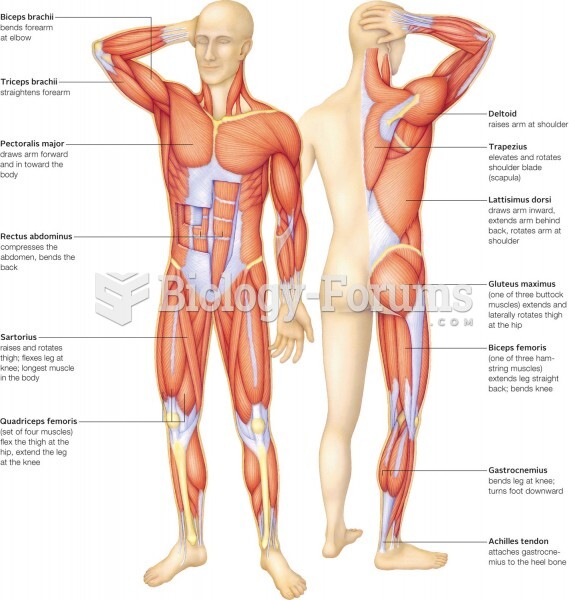 Major muscles of the human musculoskeletal system
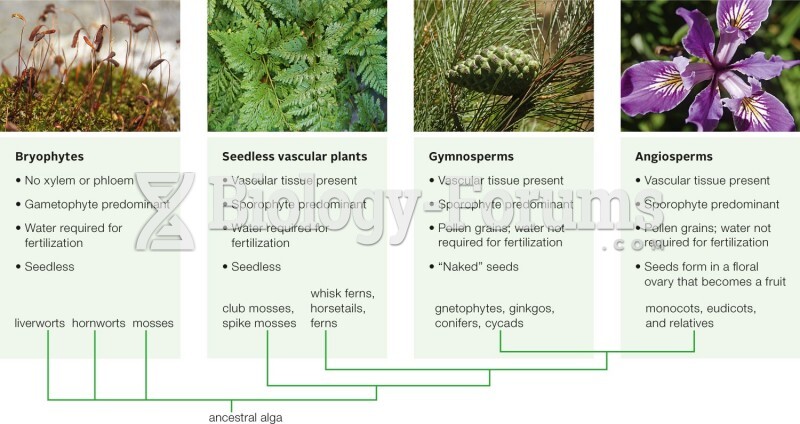 The Major Plant Groups