This topic contains a solution. Click here to go to the answer
|
|
|

 Organisms exhibit a diversity of behaviours, which include (clockwise from upper left), foraging and
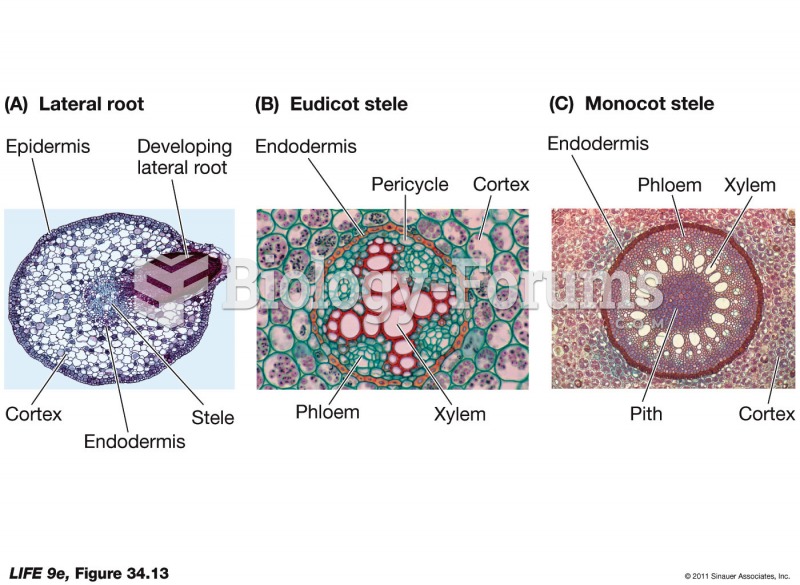 Products of the Root's Primary Meristems
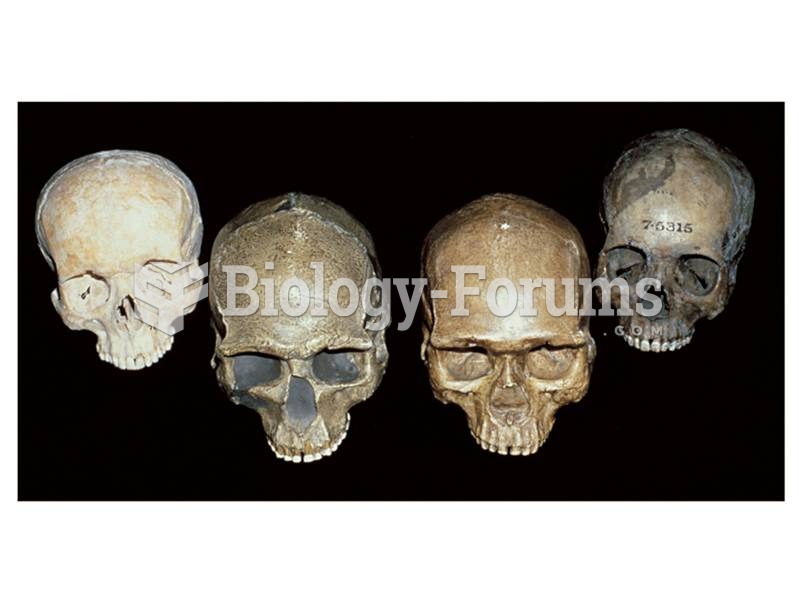 Fossil remains of anatomically modern humans from the Czech Republic and from China (center crania)
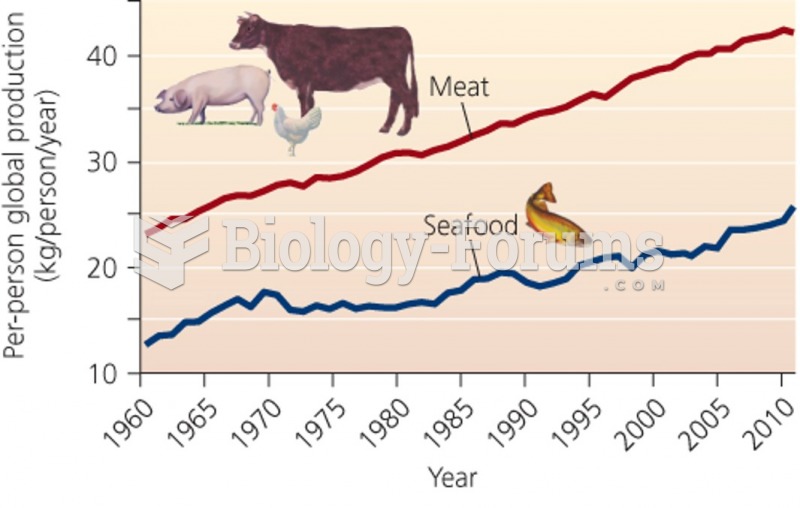 Consumption of animal products "استهلاك المنتجات الحيوانية"
 Products like Beano contain enzymes that help reduce the production of gas in the large intestine
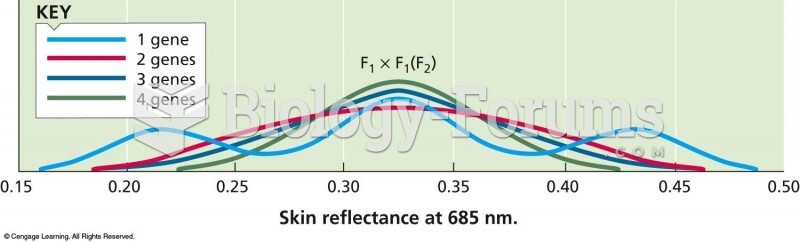 Distribution of skin color as measured by a reflectometer at a wavelength of 685 nm. The results are