This topic contains a solution. Click here to go to the answer
|
|
|

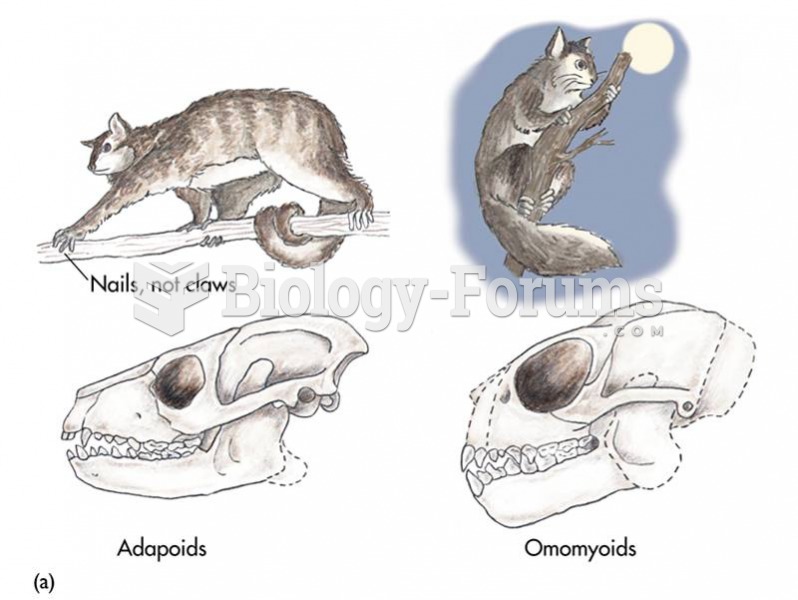 Adapoids and omomyoids had longer snouts and are the first “true” primates.
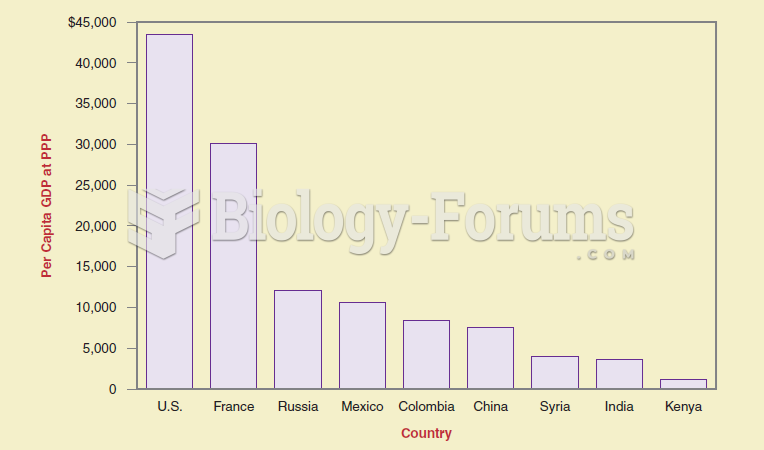 If you want to show differences between items at the same time, a bar graph is more effective than a
 The graph of y = sqrt(x) is vertically stretched by a factor
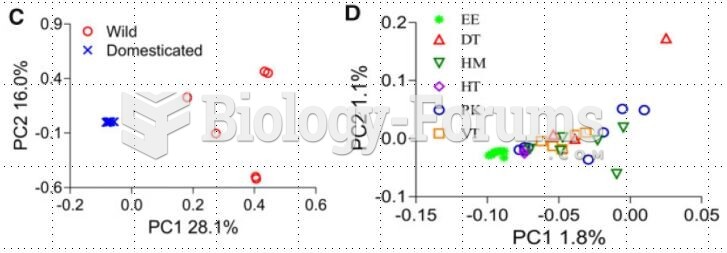 How to interpret these PCA Graph?
 CYP2D6 pharmacogenetic profile in a Swedish population
 Sketch the graph of the following functions using local maximum/minimums, interc