This topic contains a solution. Click here to go to the answer
|
|
|

 The skullcap from Trinil, Java is the type specimen for H. erectus and is about 900,000 years old.
 Testing Distance Visual Acuity Using a Snellen Eye Chart
 The chart under the cover for the relay center indicates the location of the relay that controls ...
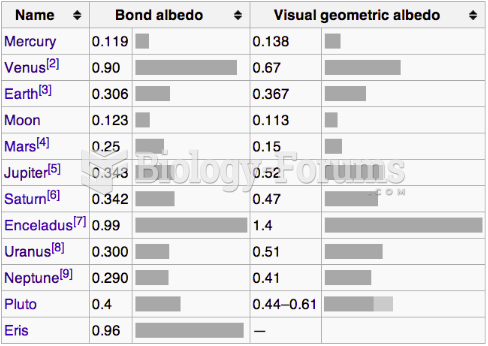 Albedo Chart
 Flowchart illustrating how genetic information encoded in DNA produces protein
 Gamete genotype frequencies calculated from genetic linkage data