|
|
|

 True-color view of Mars seen through NASA's Hubble Space Telescope in 1999
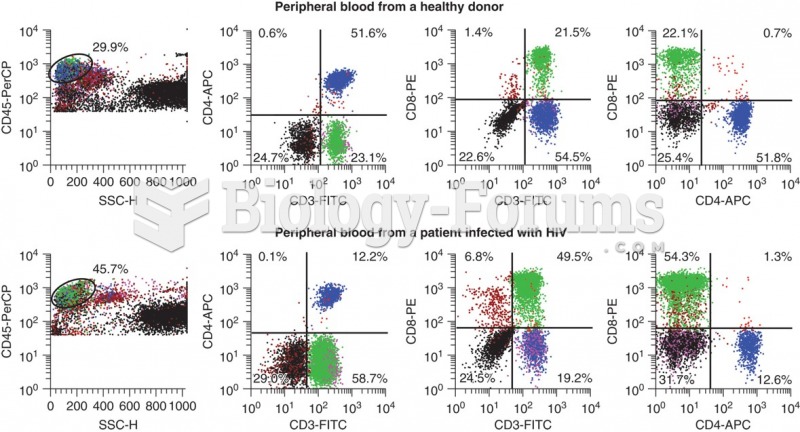 Flow cytometry data that shows the differences in CD3+ CD4+ cells that occur with HIV infection. ...
 How to fit an exponential model to data
 States that require licensing or certification. Graphic provided by Associated Bodywork & ...
 Business Intelligence, Analytics, and Data Science: A Managerial Perspective, 4th Edition
 data
data