|
|
|

 Graphic Card
 true story
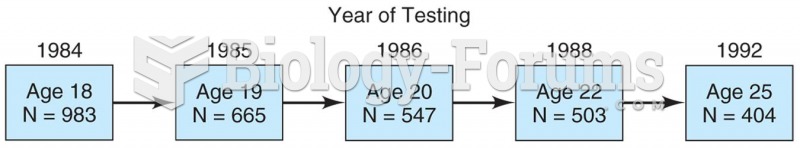 Model of a longitudinal study in which 983 students were surveyed in 1984 and then again in 1985, 19
 A physician uses a portable electronic tablet to enter patient data while in the examination room.
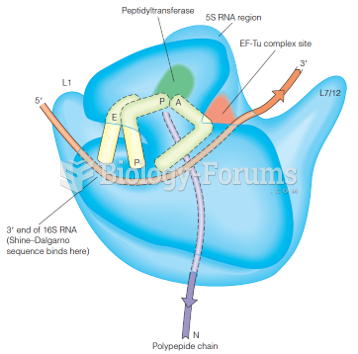 A model of the 70S ribosome based upon early structural data
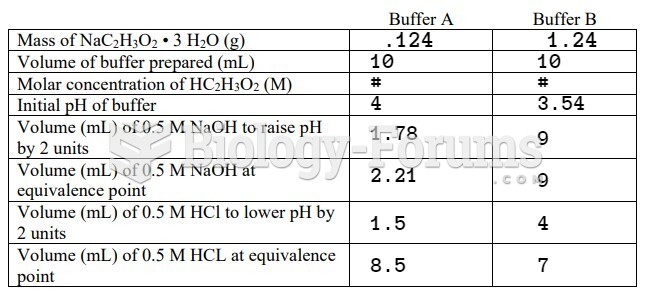 data
data