|
|
|

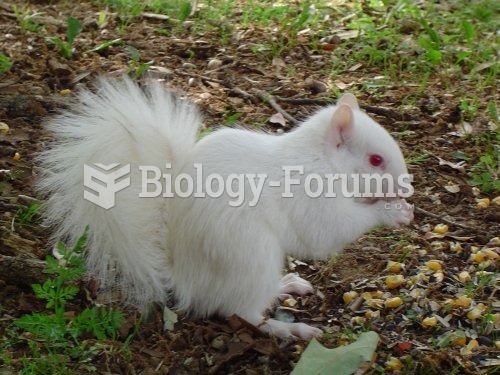 A true albino squirrel. Note the pink eyes.
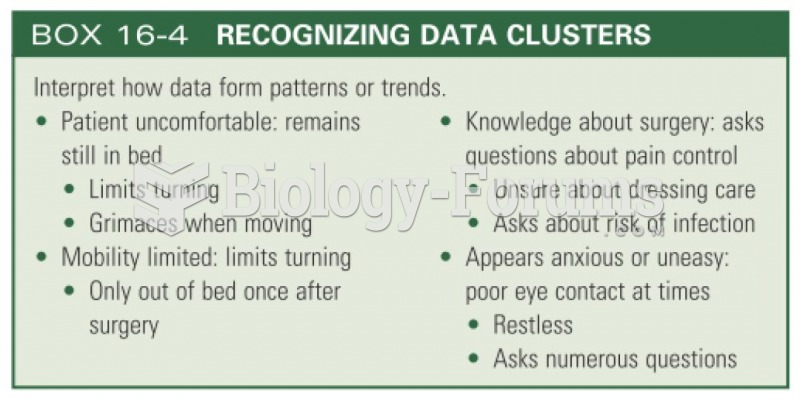 Recognizing data clusters
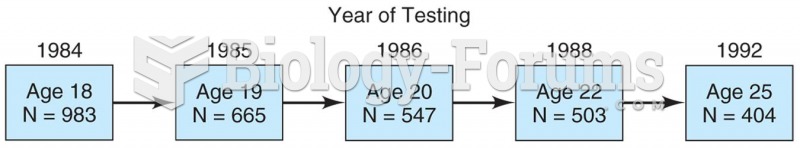 Model of a longitudinal study in which 983 students were surveyed in 1984 and then again in 1985, 19
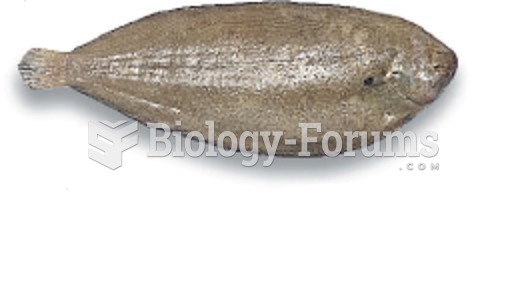 True Dover Sole
 graphic(04-40.jpg) Mary pushes horizontally on a large, heavy table which is s
 Linkage Data from 39 Families with Cystic Fibrosis