In a report, when you want to visually display the relationships between parts and a whole, you should use a:
A. pie chart.
B. histogram.
C. line graph.
D. flow chart.
Question 2
Which of the following practices is best avoided when preparing a business report?
A. Placing the executive summary after the introduction section
B. Including the name of the person for whom the report is prepared in the title page
C. Drawing conclusions for the report from personal observations
D. Including information in the body of the report, about how the research was done

 Parts of a muscle
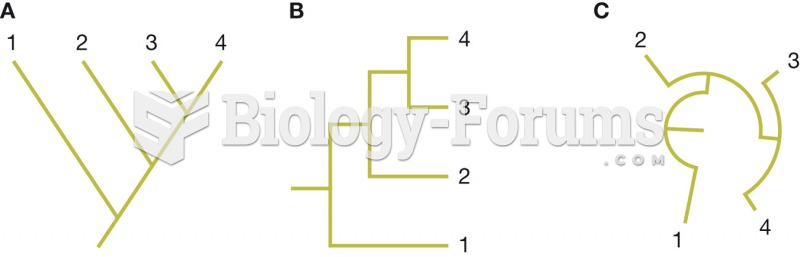 Different ways to depict phylogenetic relationships
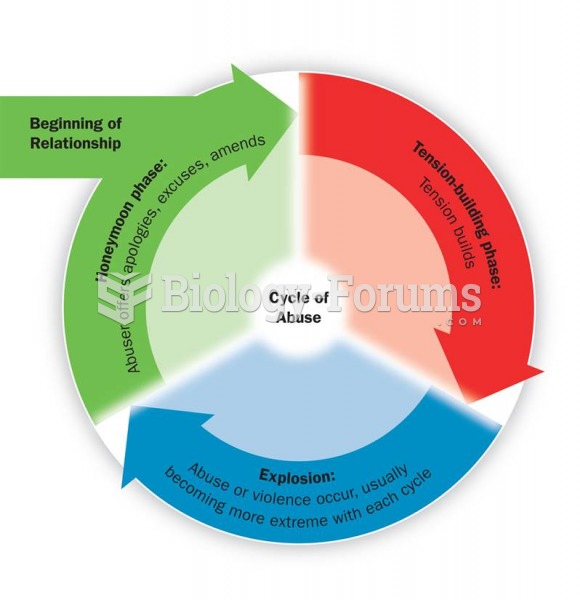 The Cycle of Violence and Abuse in Intimate Relationships
 Sibling relationships can be intense, in terms of both having fun together and engaging in conflict.
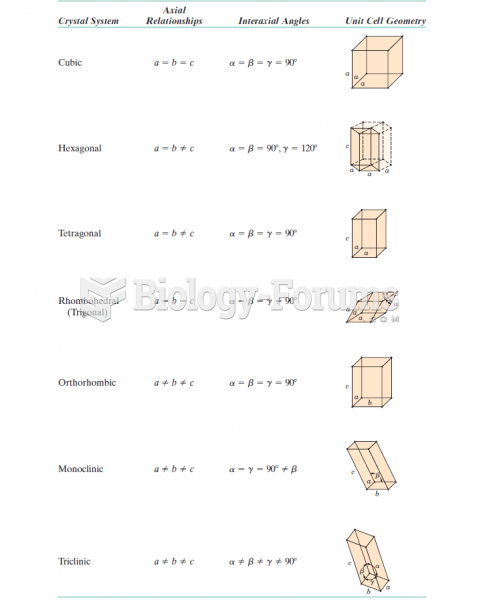 Lattice Parameter Relationships and Figures Showing Unit Cell Geometries for the Seven Crystal Syste
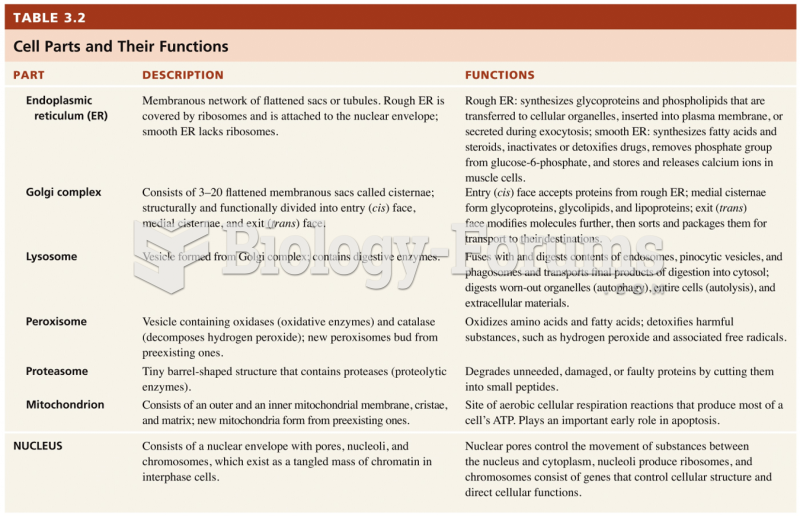 Cell parts and their functions