This topic contains a solution. Click here to go to the answer
|
|
|

 Latest Post Display
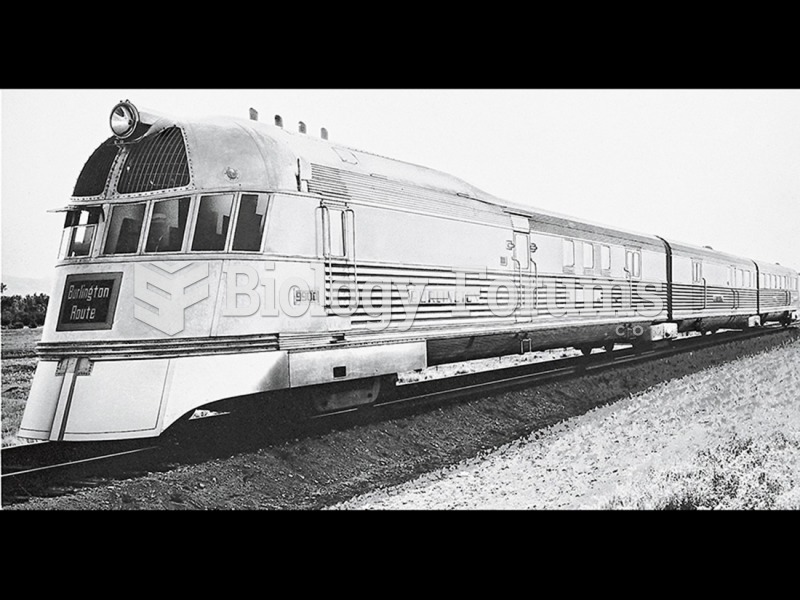 Chrysler Salon, N. Y. C., showing the 1937 Chrysler Airflow four-door sedan on display in the ...
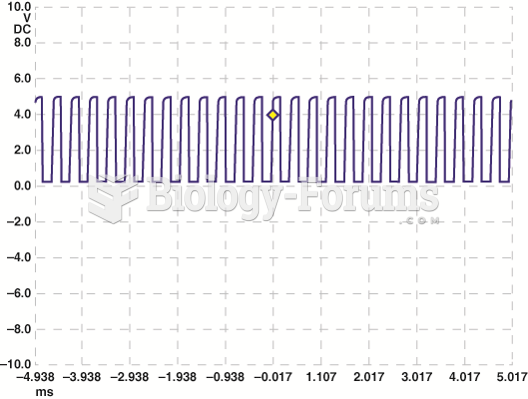 A scope display showing a normal Chevrolet Equinox MAF sensor at idle speed. the frequency is 2,600 ...
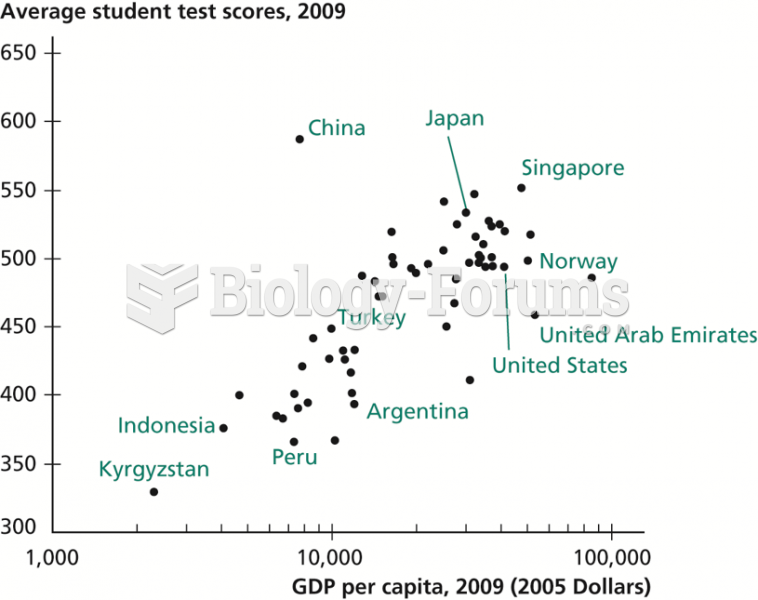 Student Test Scores versus GDP per Capita
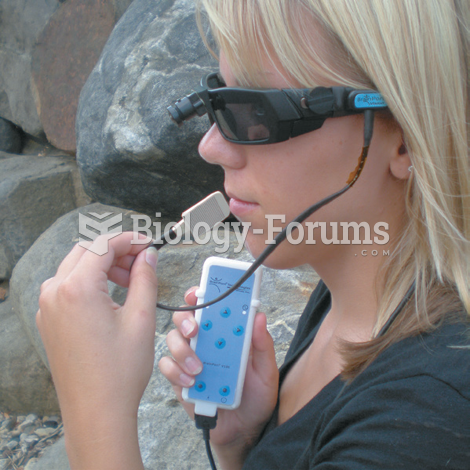 Sensory Crossover Device for Visually Impaired People
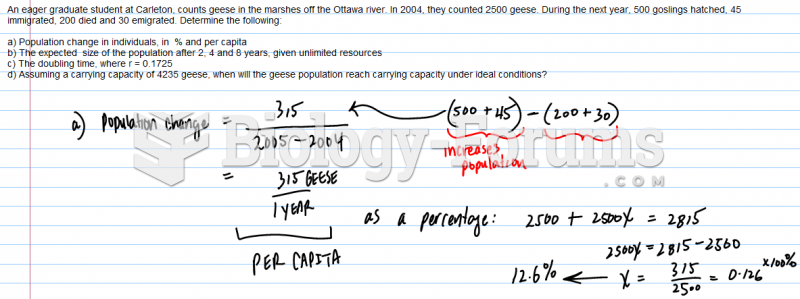 An eager graduate student at Carleton, counts geese in the marshes off the Ottawa river. In ...