This topic contains a solution. Click here to go to the answer
|
|
|

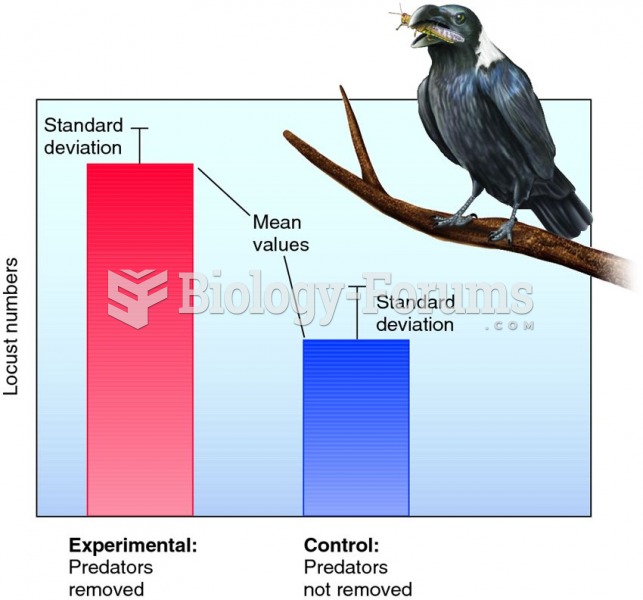 Graphic display of hypothetical results of a predator removal experiment.
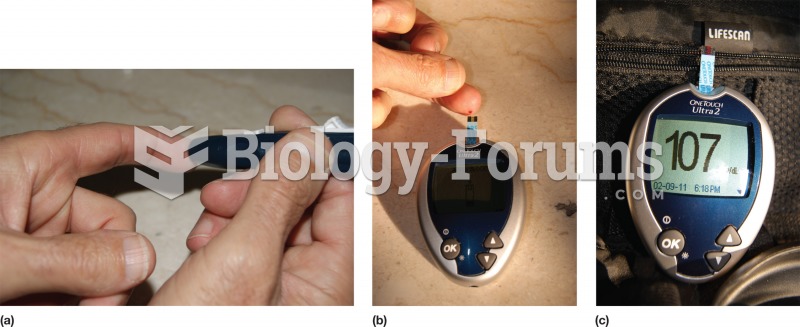 Blood glucose measurement. A postprandial test may be self-administered. (a) A lance pierces the ski
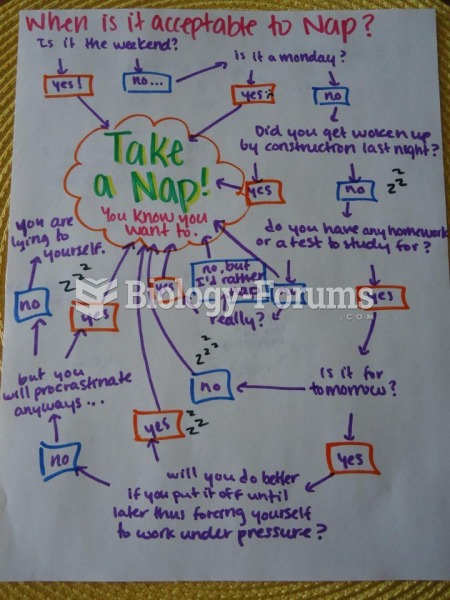 how a nursing student thinks
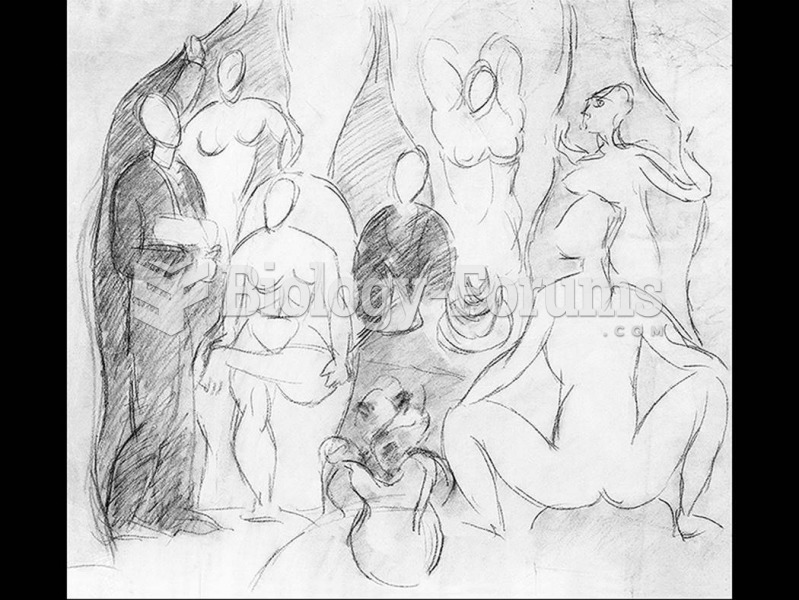 Pablo Picasso, Medical Student, Sailor, and Five Nudes in a Bordello (Compositional study for Les ...
 Display is the only position to view the firing lines of all cylinders. Cylinder 1 is displayed on ...
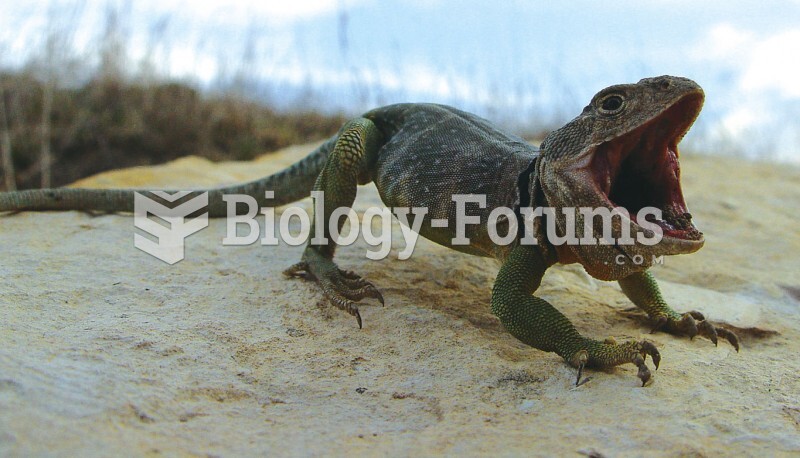 Threat Display: Male Collared Lizard