In a report, when you want to visually display the relationships between parts and a whole, you should use a:
A. pie chart.
B. histogram.
C. line graph.
D. flow chart.
Question 2
Which of the following practices is best avoided when preparing a business report?
A. Placing the executive summary after the introduction section
B. Including the name of the person for whom the report is prepared in the title page
C. Drawing conclusions for the report from personal observations
D. Including information in the body of the report, about how the research was done

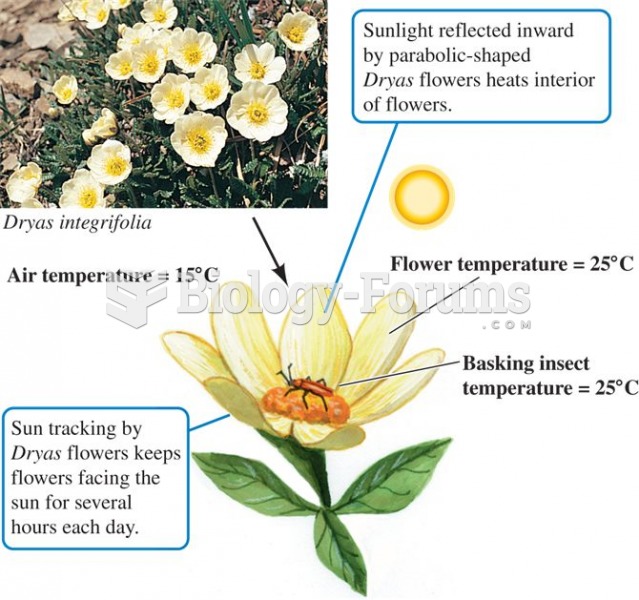 Sun-tracking behaviour of the arctic plant, Dryas integrifolia, heats the reproductive parts of its
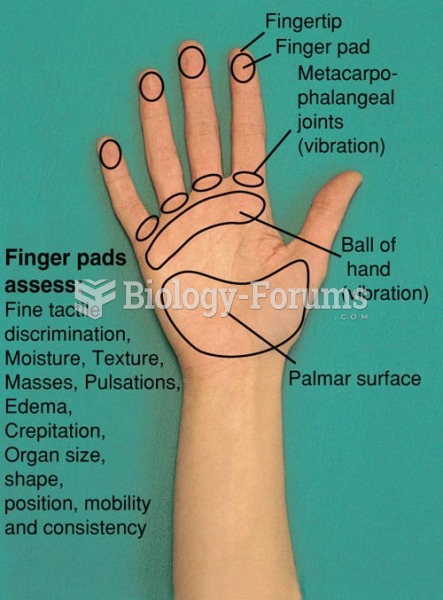 Parts of the Hand Used in Palpation; Dorsal Surface
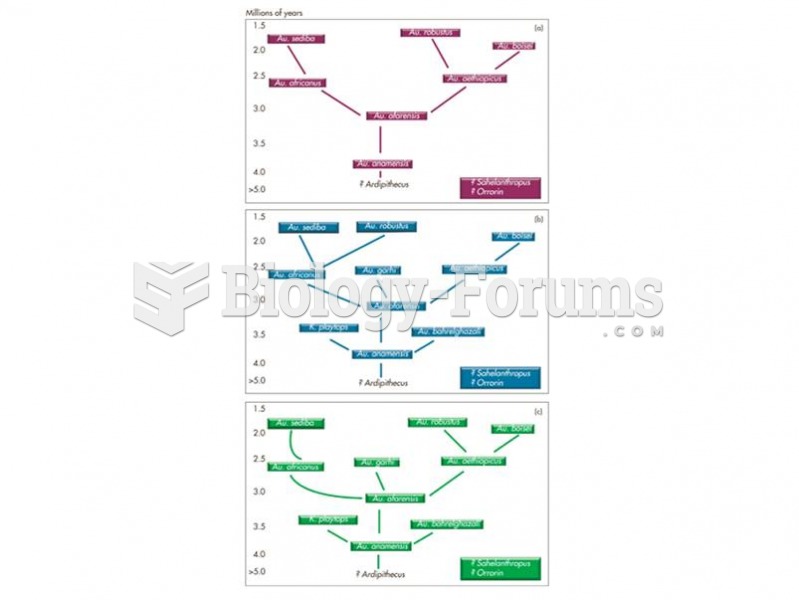 Three possible phylogenies for the australopithecines with Au. anamnesis as the stem ancestor and re
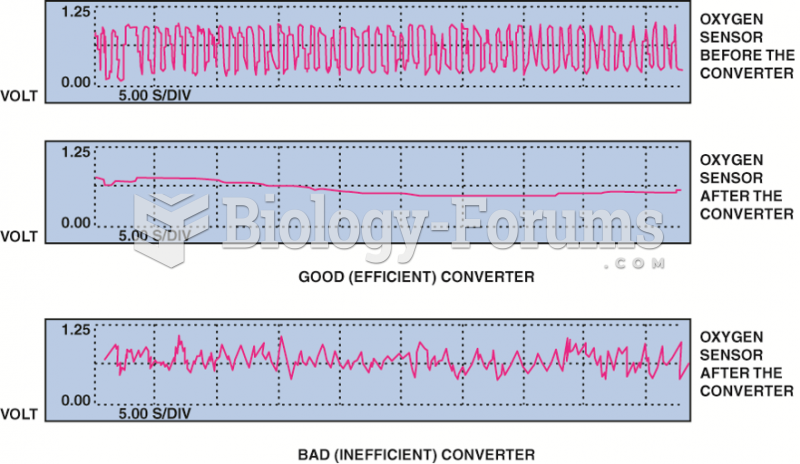 The post-catalytic converter oxygen sensor should display very little activity if the catalytic ...
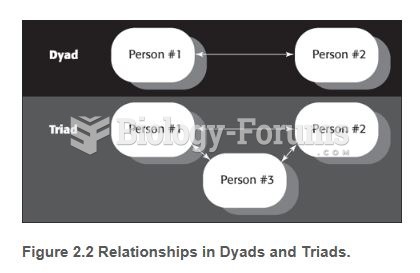 Relationships in Dyads and Triads
 Cell parts and their functions