This topic contains a solution. Click here to go to the answer
|
|
|

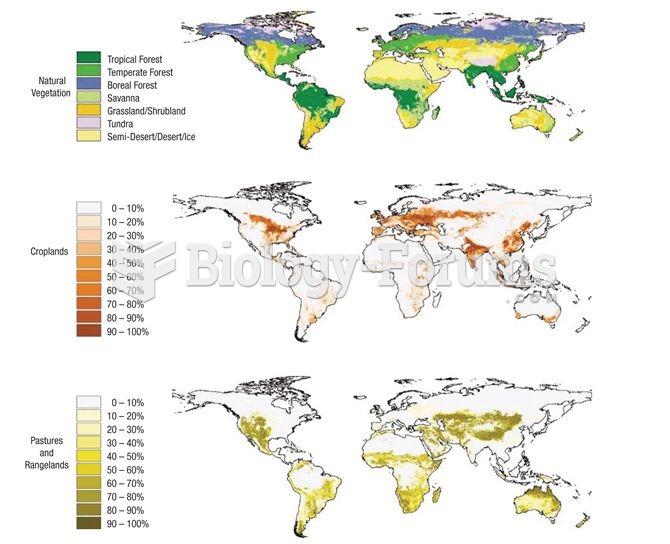 Extent of agricultural activity across the planet (data from Foley et al. 2005).
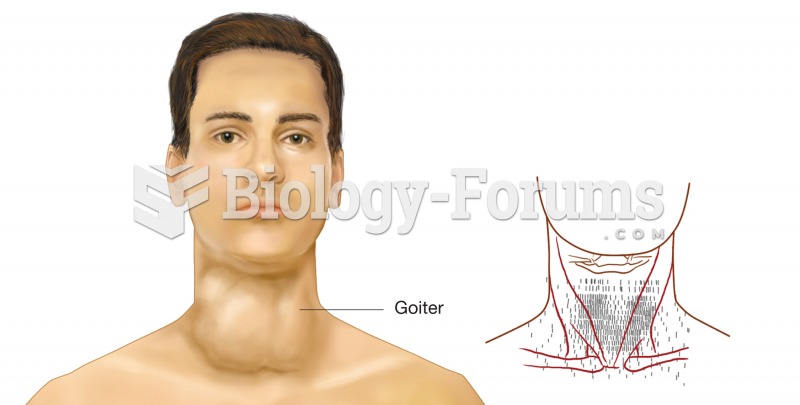 Thyroid scan. The right image is the data from a thyroid scan, printed on a superimposed map of the
 Acquiring Weather Data
 The human HLA complex and its different regions.
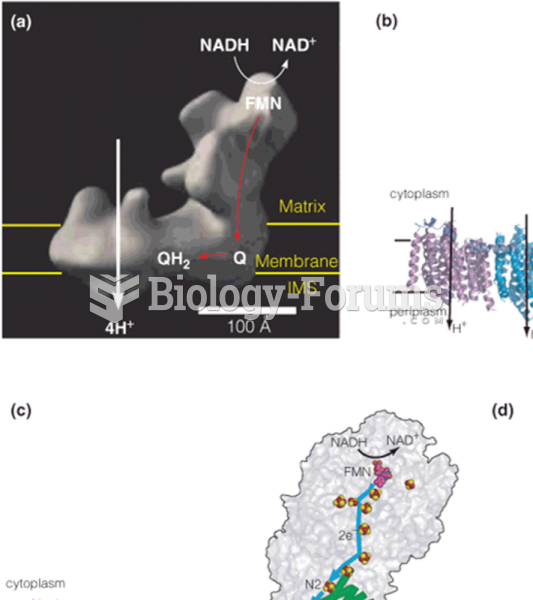 Structure and function of complex I (NADH–coenzyme Q reductase)
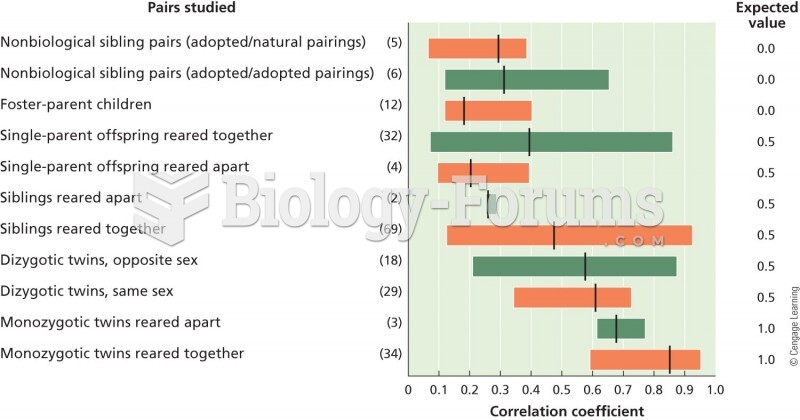 A graphical representation of correlations in IQ measurements in different sets of individuals. The