This topic contains a solution. Click here to go to the answer
|
|
|

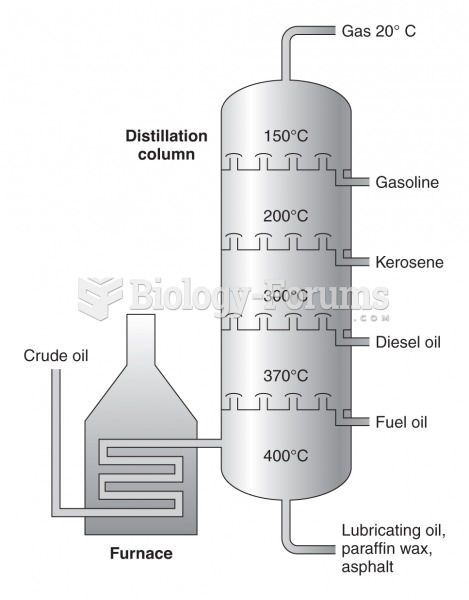 Simplified diagram of the fractional distillation process
 Three days after the Boston Marathon explosion, the FBI released this photograph that had been taken
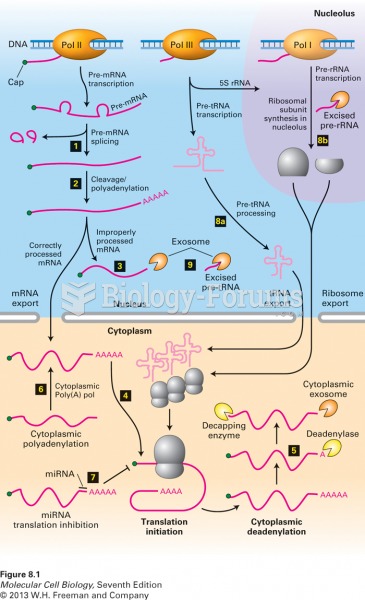 Overview of RNA processing and posttranscriptional gene control
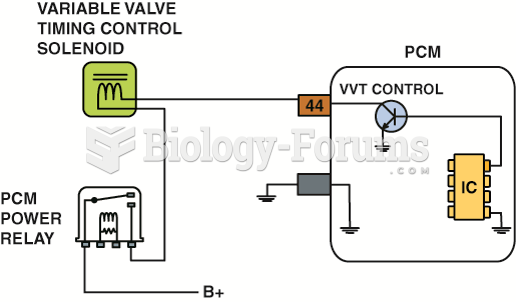 The schematic of a variable valve timing control circuit, showing that battery power (+) is being ...
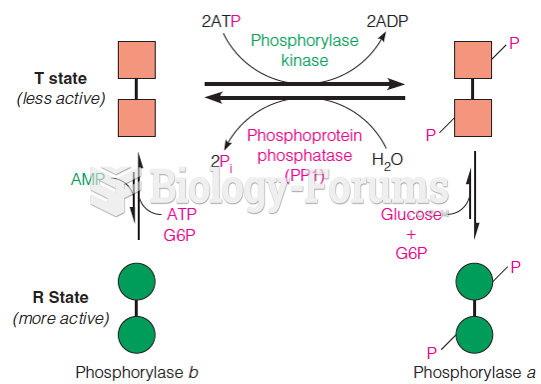 Control of glycogen phosphorylase activity
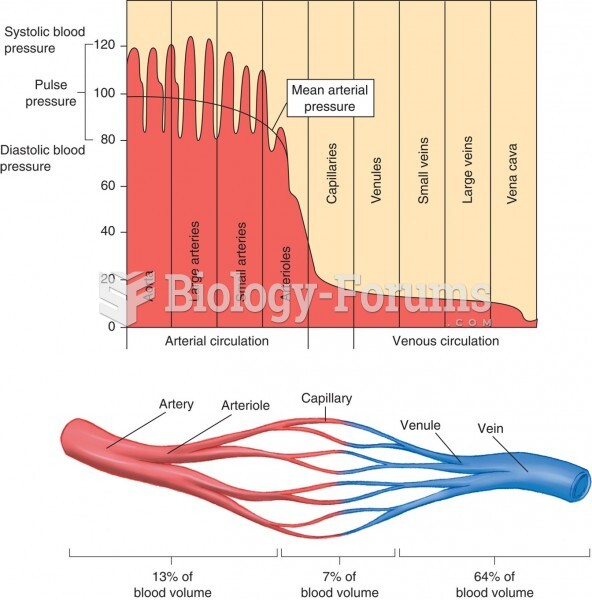 Vascular Distribution and Control of Circulation