This topic contains a solution. Click here to go to the answer
|
|
|

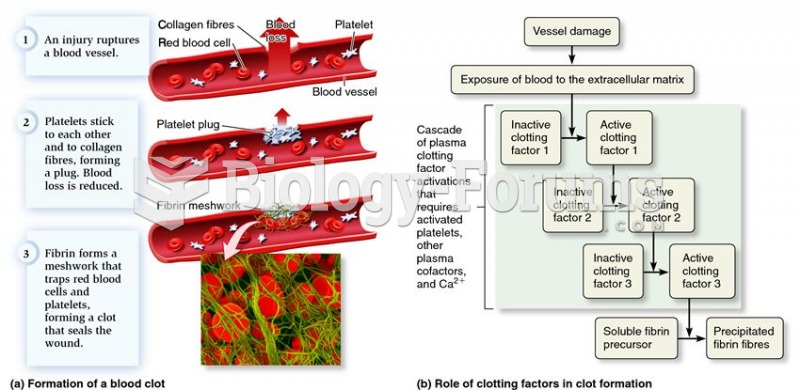 Platelets and the process of blood clot formation.
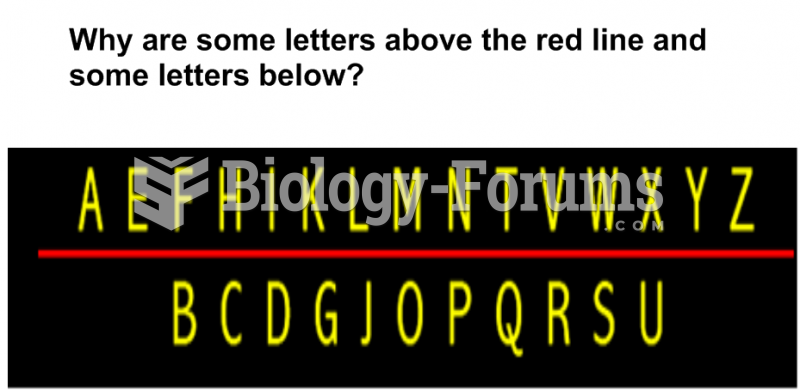 Why are some of the letters above the red line and some letters below?
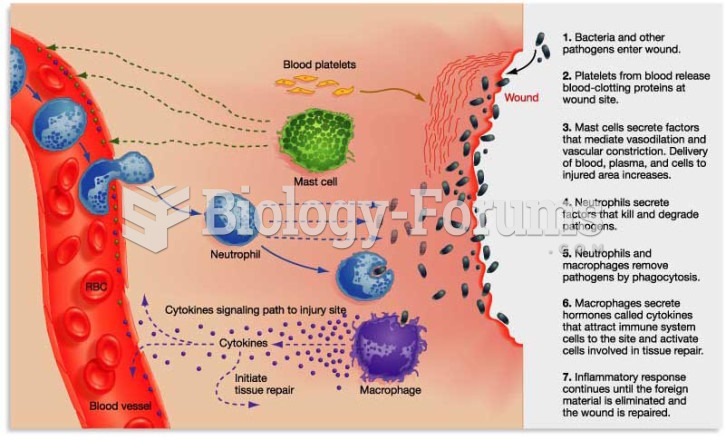 Inflammation Process
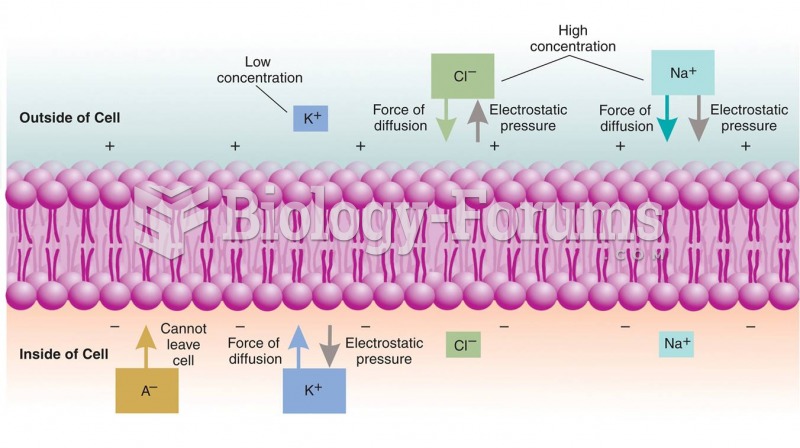 Control of the Membrane Potential
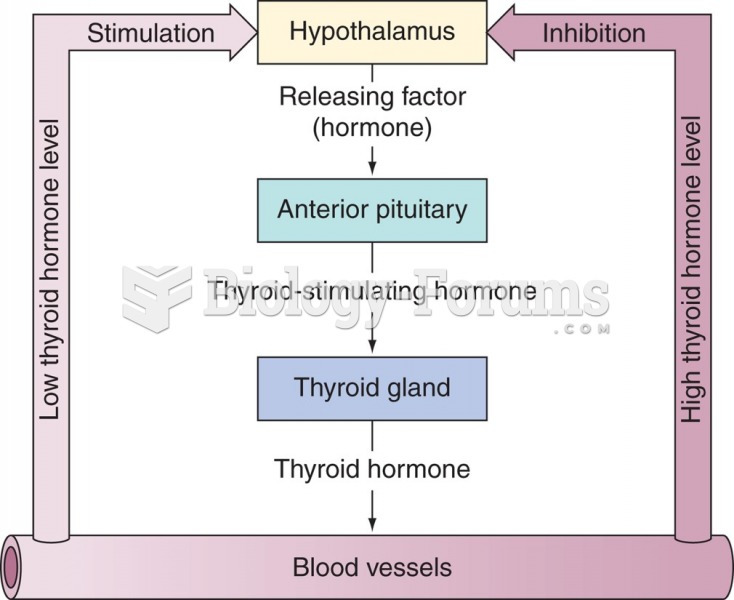 Control of thyroxine secretion through negative feedback.
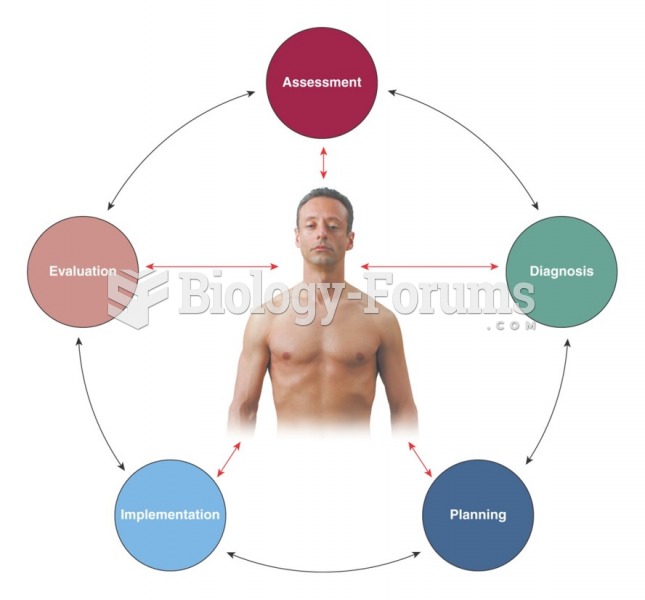 Nursing process