This topic contains a solution. Click here to go to the answer
|
|
|

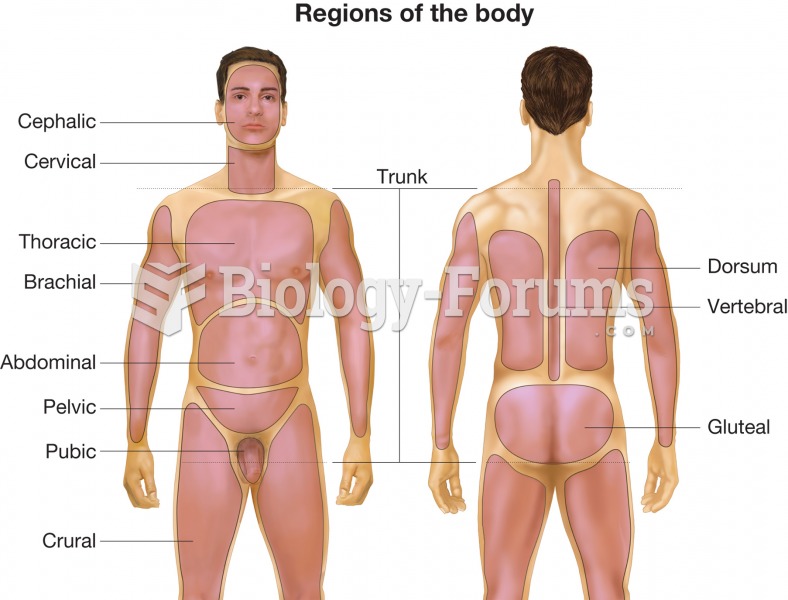 Anterior and posterior views of the body illustrating the location of various body regions.
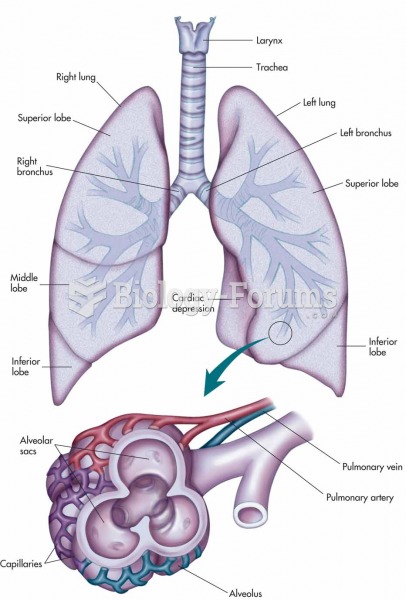 Larynx, trachea, bronchi, and lungs with an expanded view showing the structures of an alveolus and
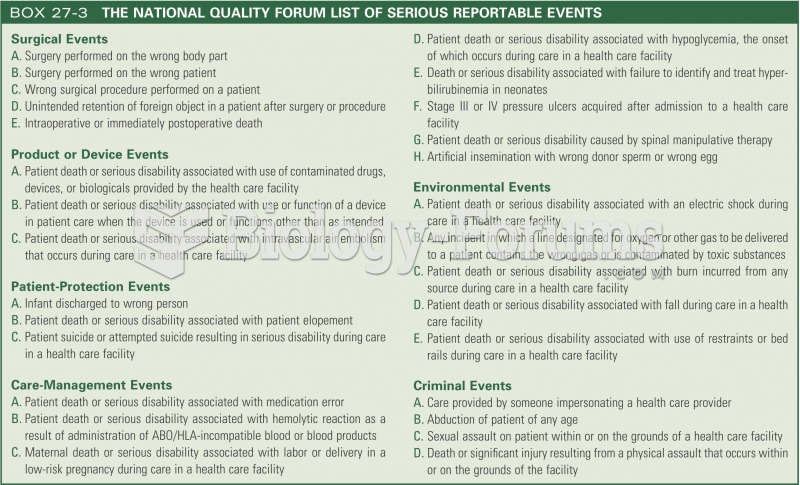 The national quality forum list of serious reportable events
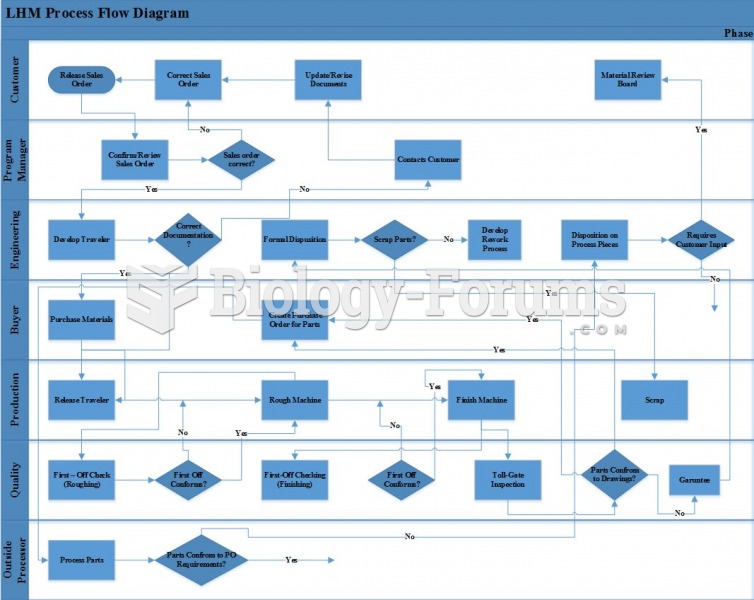 Lean 6 Sigma - LHM Process Flow Diagram
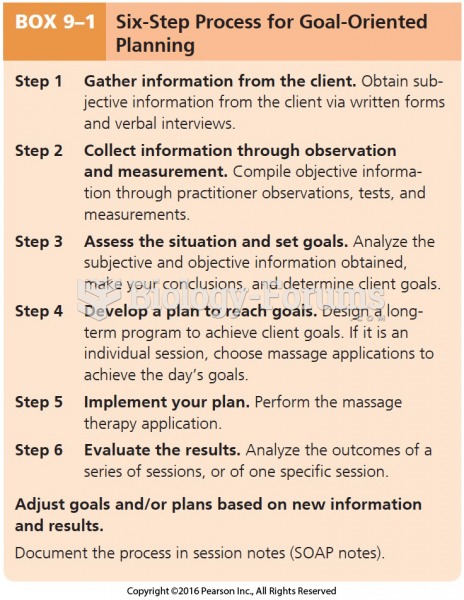 Six-Step Process for Goal-Oriented Planning
 Find the curved line