|
|
|

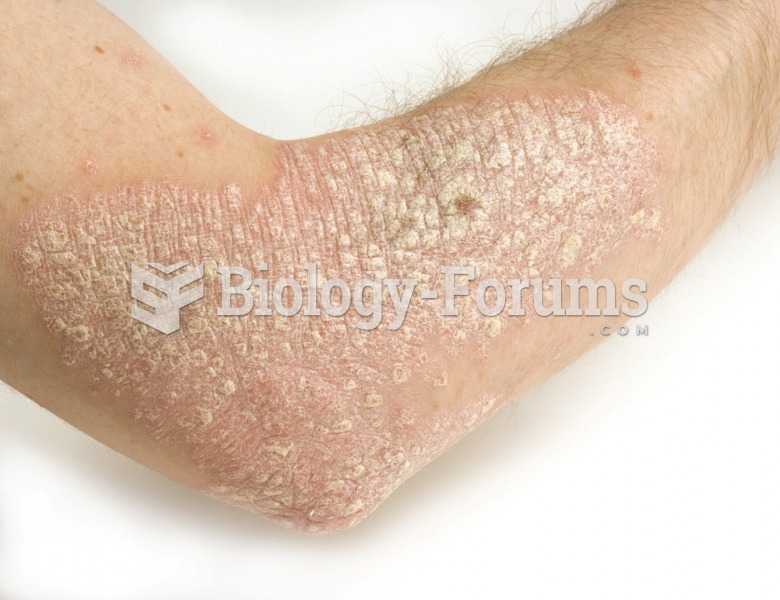 Psoriasis. This photograph demonstrates the characteristic white skin patches of this condition.
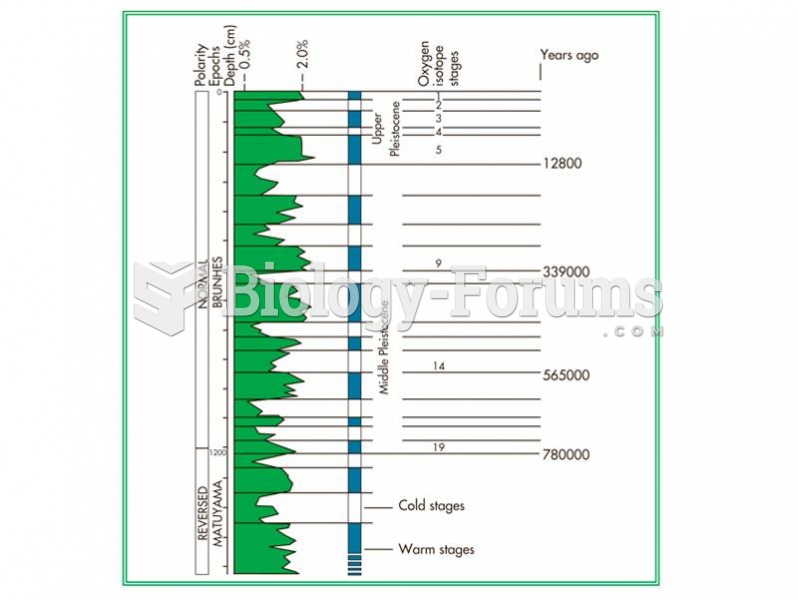 The oxygen isotope curve illustrates the ratio between 16O and 18O.
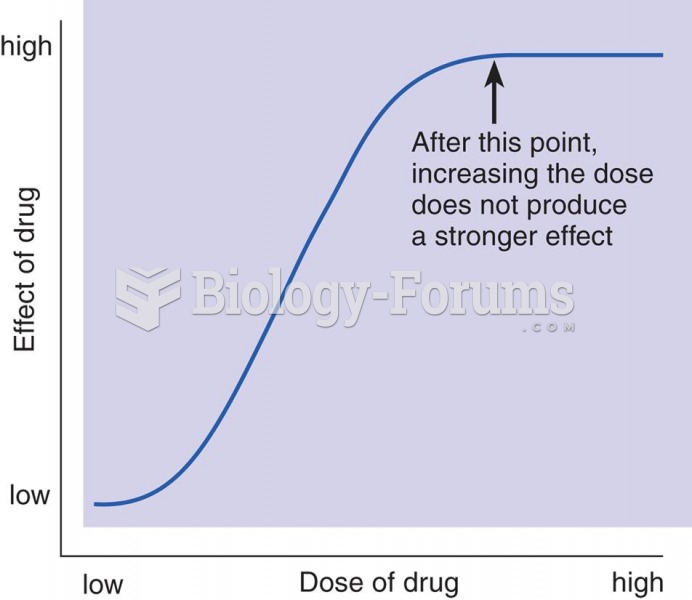 A Dose-Response Curve
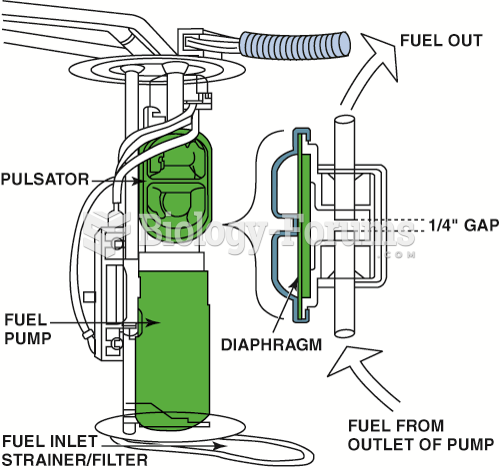 A typical fuel pulsator used mostly with roller vane-type pumps to help even out the pulsation in ...
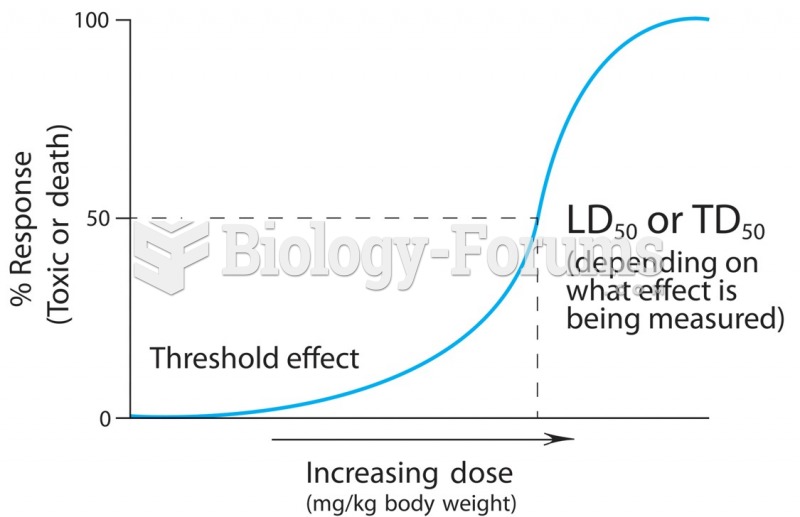 A dose-response curve describes the relationship between the quantity of the chemical entering the ...
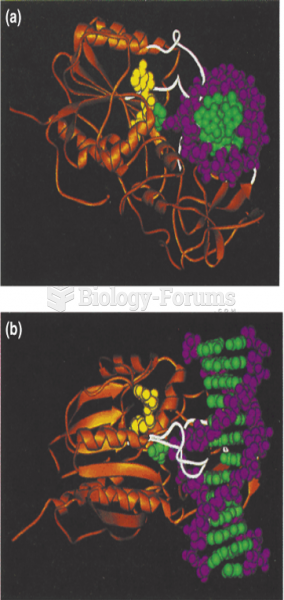 Structure of a complex of a type II DNA methylase with DNA