This topic contains a solution. Click here to go to the answer
|
|
|

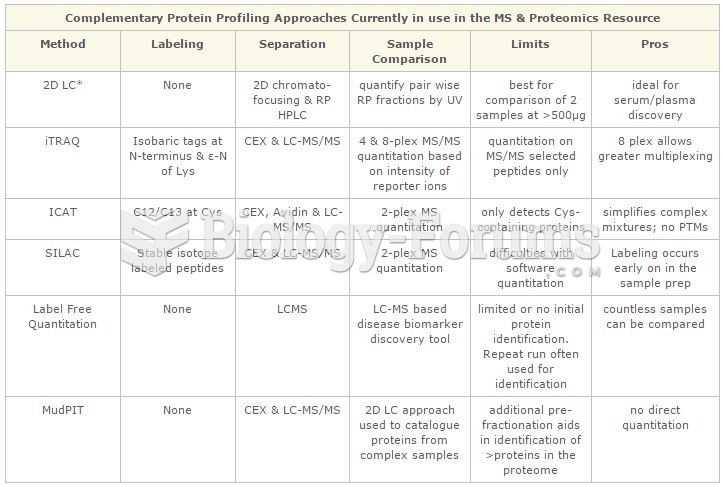 Protein Profiling Chart
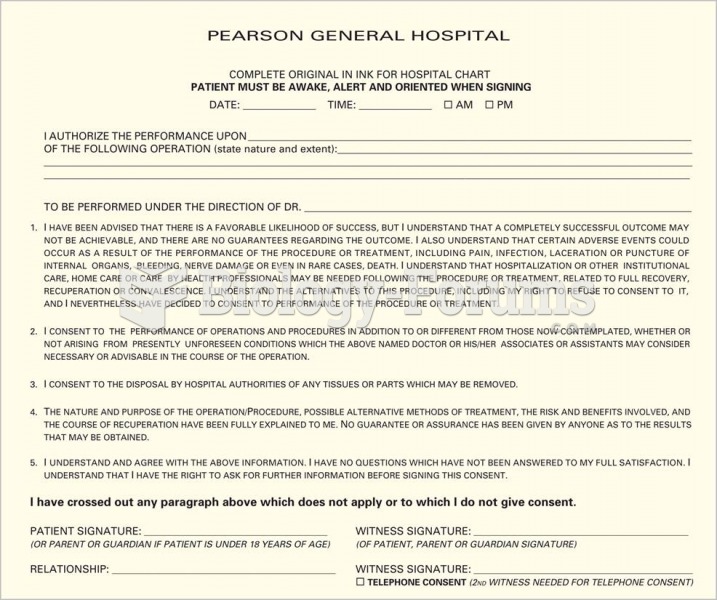 Sample of an informed consent to perform an operation, sedation, anesthesia, and other medical servi
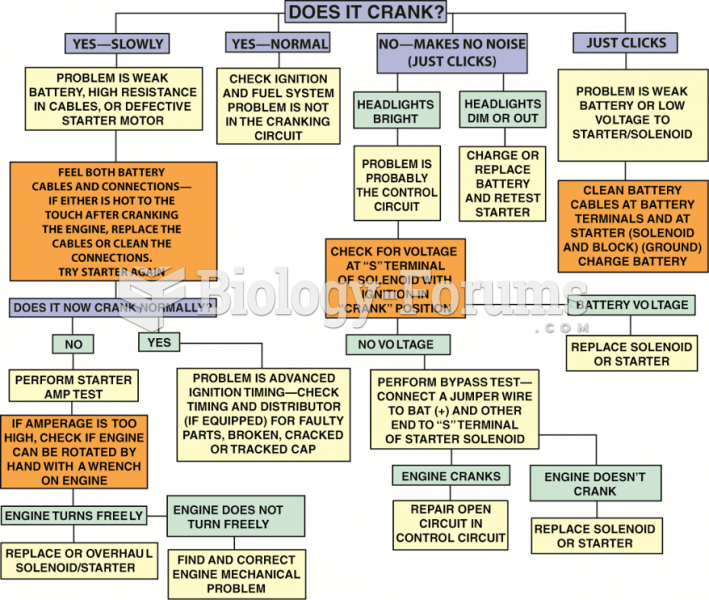 Starter diagnosis chart.
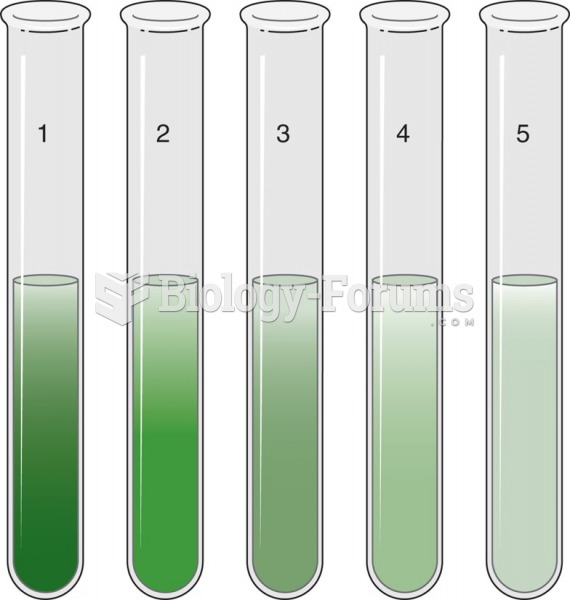 A 2-fold serial dilution showing the result of moving 0.2 ml of green food coloring successively ...
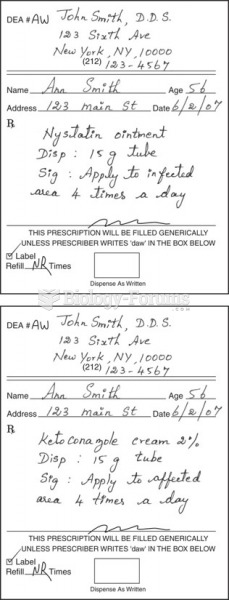 Sample prescriptions of drugs for oral fungal infections.
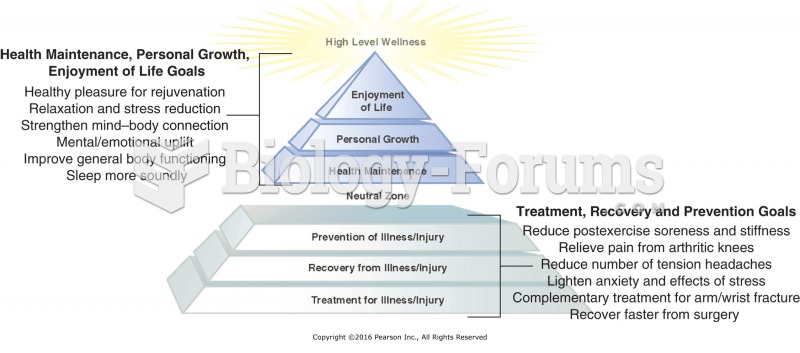 Sample client goals from the Wellness Massage Pyramid.