This topic contains a solution. Click here to go to the answer
|
|
|

 teach their children to care for the earth in hopes of passing on a better world to future generatio
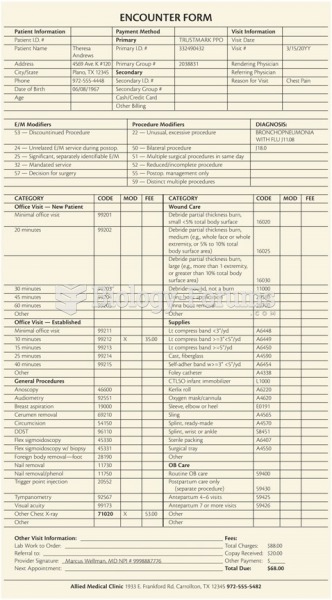 A sample encounter form.
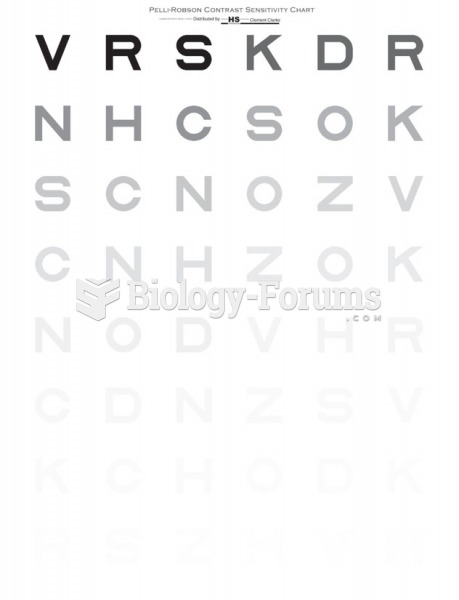 Pelli-Robson contrast sensitivity chart.
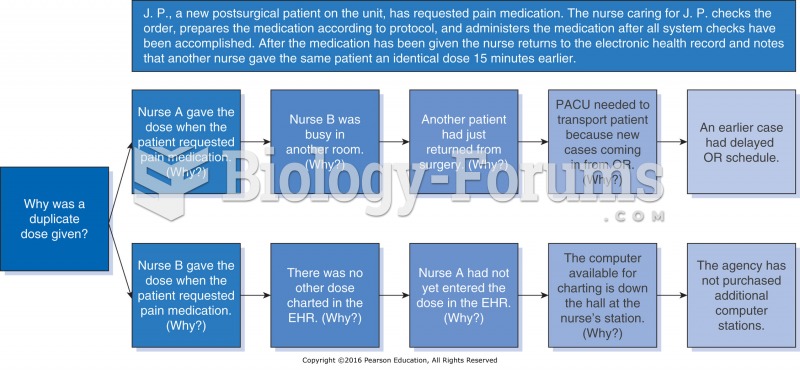 Sample root cause analysis: Duplicate dose of a narcotic analgesic.
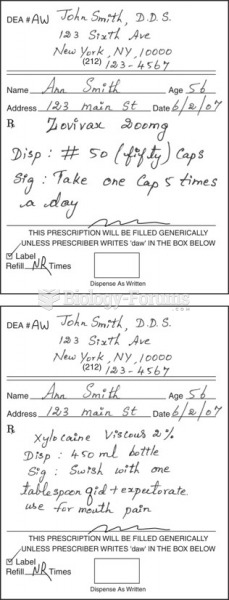 Sample prescriptions of drugs for oral herpes infection.
 A truncated cell lineage chart for C. elegans