This topic contains a solution. Click here to go to the answer
|
|
|

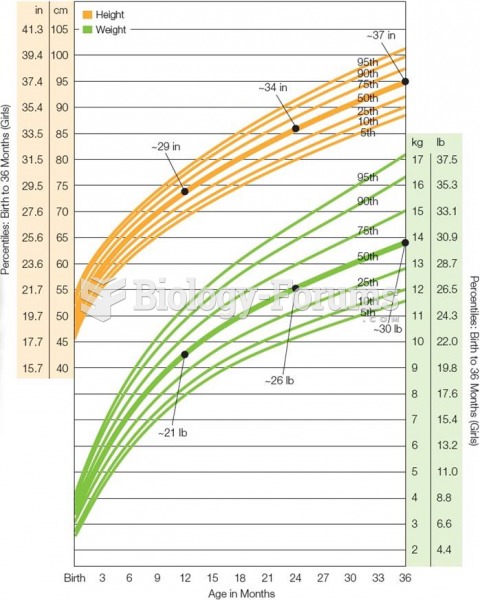 Growth Chart for American Girls From Birth Through Age 3 Growth slows from infancy to toddlerhood b
 Archaea, Eukarya, Bacteria Differences Chart
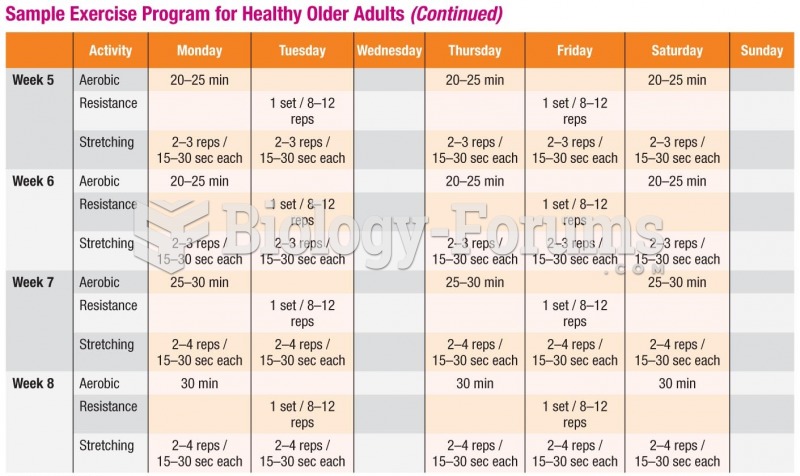 Sample Exercise Program for Healthy Older Adults (cont.)
 Sample tiered drug formulary for antibiotics.
 Metric conversion using the place value chart.
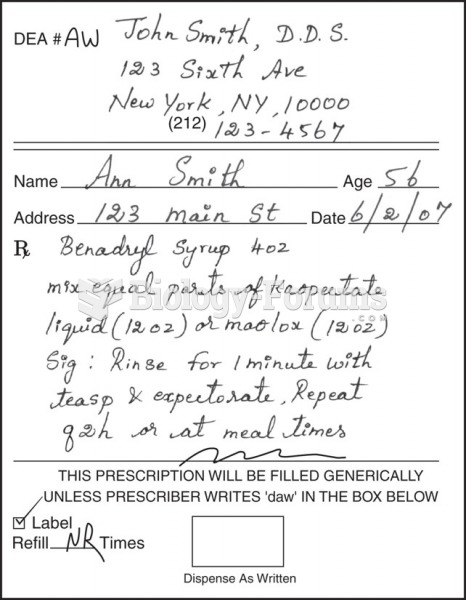 Sample prescriptions of drugs for oral herpes infection.