|
|
|

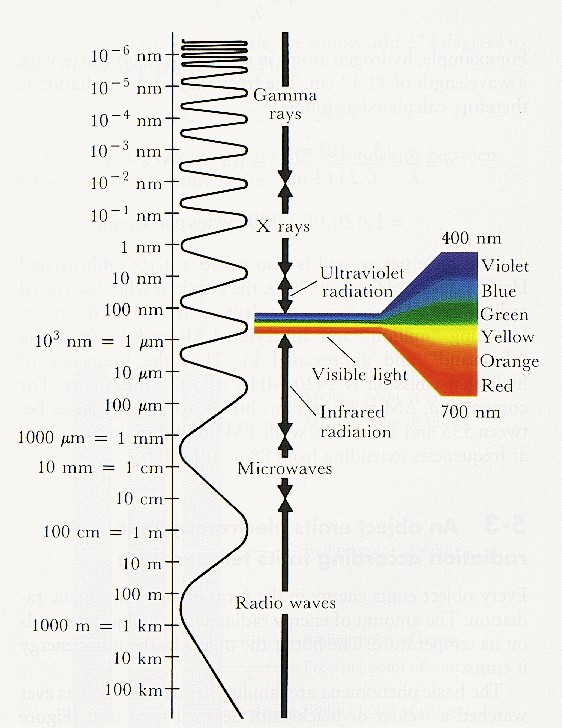 Electromagnetic Radiation Chart
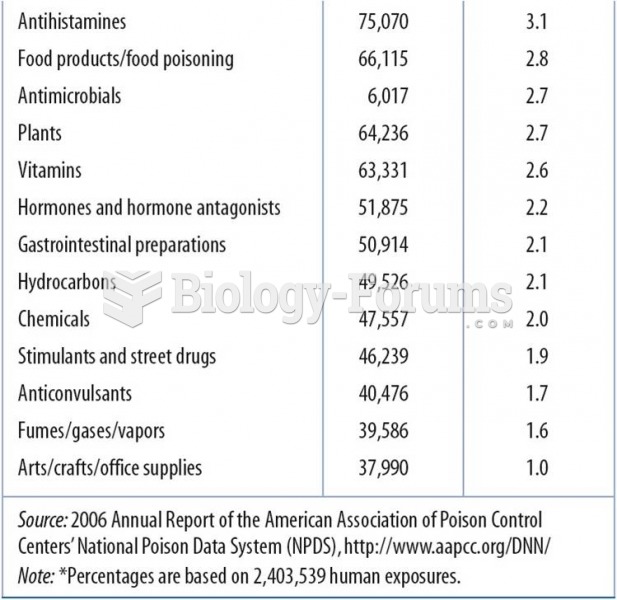 2006 Data:Top 25 Substances Involved in Human Exposures
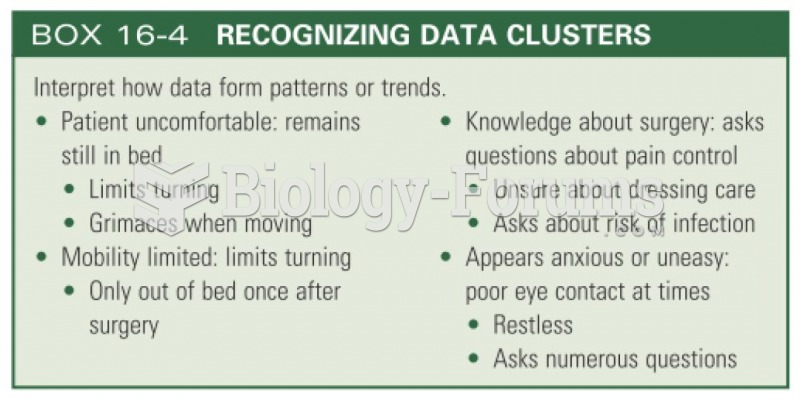 Recognizing data clusters
 All messages must be documented and placed in the patient's chart.
 Always use the viscosity of oil as specified on the oil fill cap.
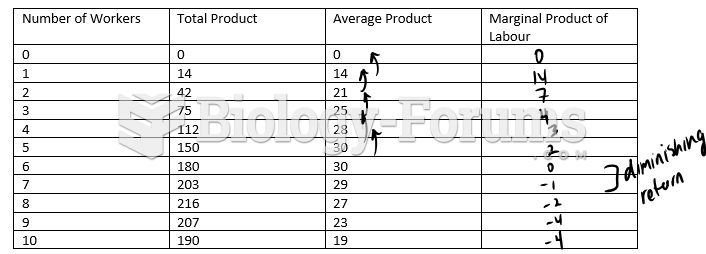 Complete the following production chart and plot the points.