|
|
|

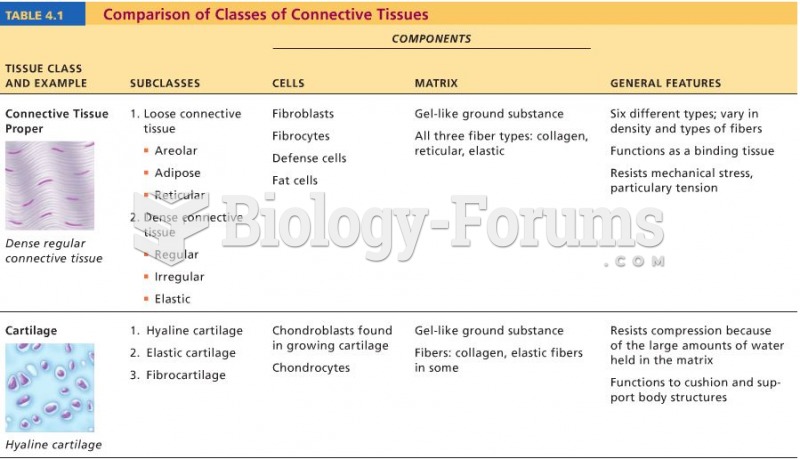 Tissue Chart
 Codon Chart
 Growth cones. The cytoplasmic fingers (the filopodia) of growth cones seem to grope for the correct ...
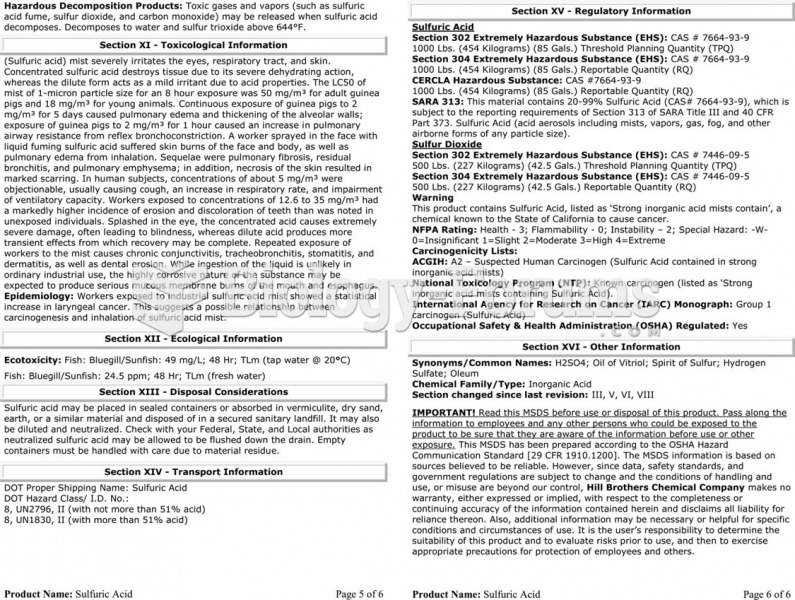 The material safety data sheet (MSDS) for sulfuric acid showing the detailed technical information ...
 Demographic Data for India
 A truncated cell lineage chart for C. elegans