|
|
|

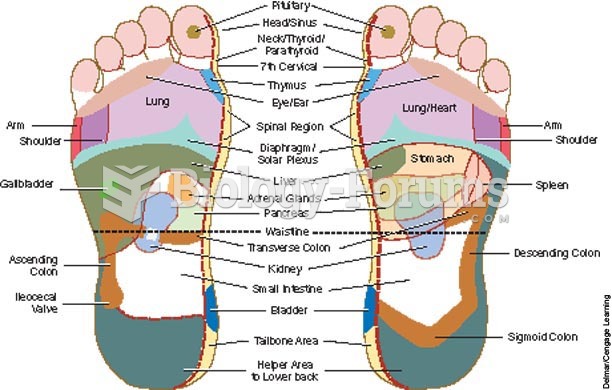 Foot reflexology chart indicates points on the foot that reflexively correspond to other areas of th
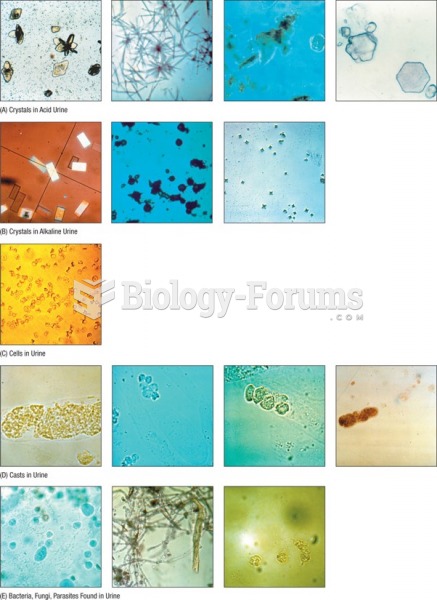 Urine sediment chart.
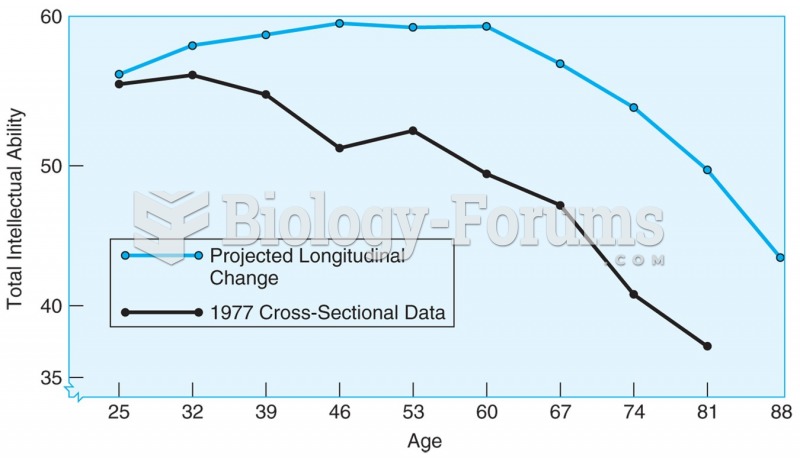 4.1 Age changes in total IQ based on cross-sectional data (lower line) and longitudinal data ...
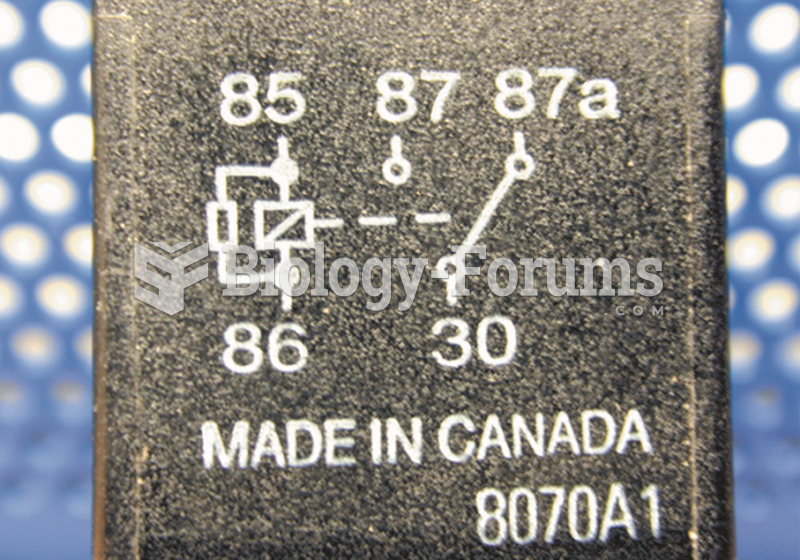 Terminals 85 and 86 represent the coil inside the relay. Terminal 30 is the power terminal, 87a is ...
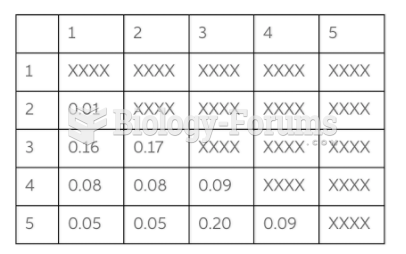 Chart
Chart
 Ribosome structure and tRNA-binding sites interpreted from cryo-EM–generated data