A graphical method that can be used to show both the rank order and shape of a data set simultaneously is a _____.
a. relative frequency distribution
b. pie chart
c. stem-and-leaf display
d. pivot table
Question 2
Random samples of size 17 are taken from a population that has 200 elements, a mean of 36, and a standard deviation of 8 . Which of the following best describes the form of the sampling distribution of the sample mean for this situation?
a. Approximately normal because the sample size is small relative to the population size
b. Approximately normal because of the central limit theorem
c. Exactly normal
d. None of these alternatives is correct.

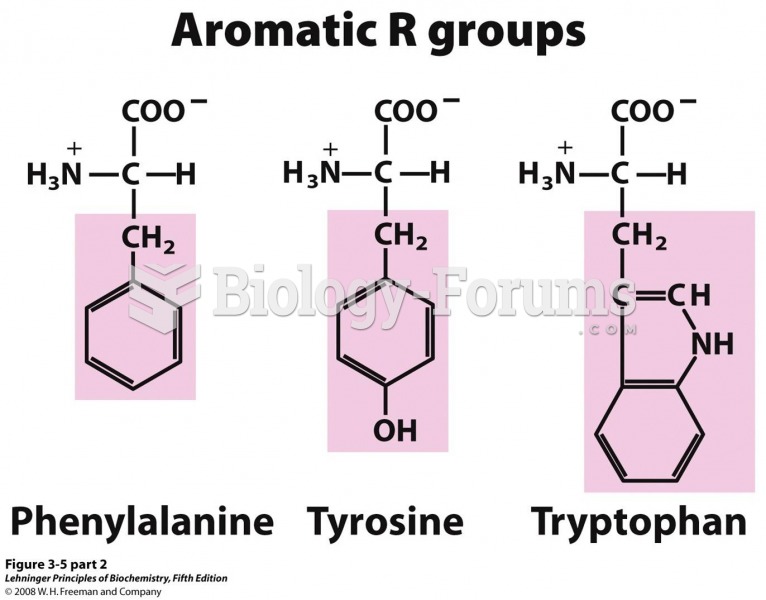 The structural formulas show the state of ionization that would predominate at pH 7.0
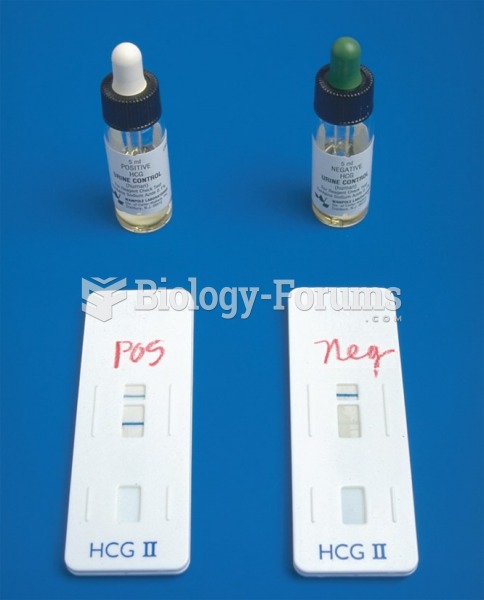 Performing a Urine Pregnancy Test Using the Enzyme Immunoassay Method
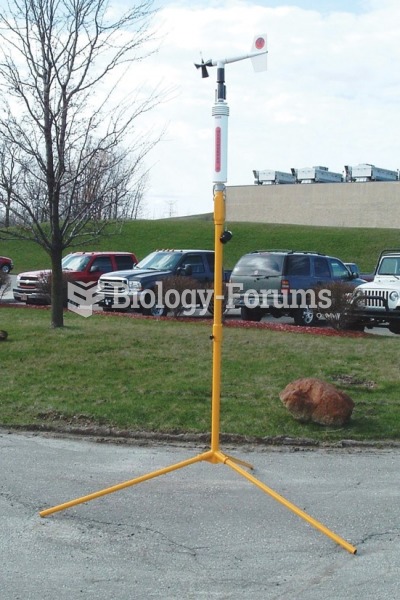 A mobile weather station that can be used to gather current weather data at the scene of hazardous ...
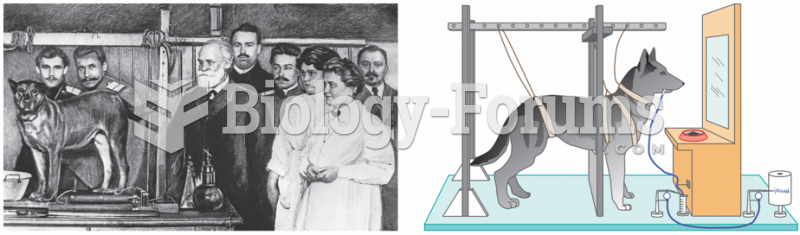 Pavlov’s Method
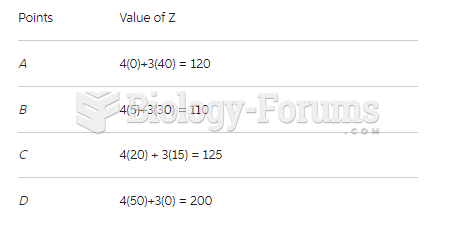 linear programming problem, applying simplex method and sensitivity analysis
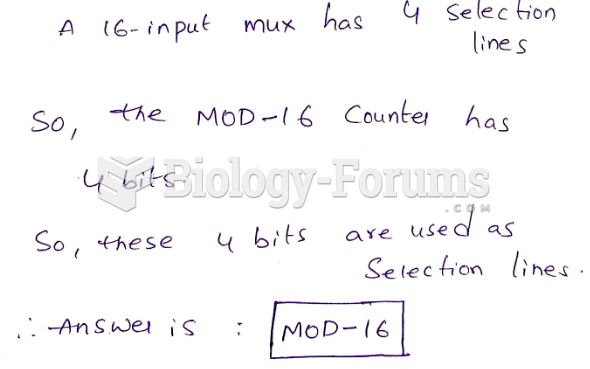 A 16-input multiplexer is to be used to perform parallel-to-serial data conversion. Which of ...