A graphical method that can be used to show both the rank order and shape of a data set simultaneously is a _____.
a. relative frequency distribution
b. pie chart
c. stem-and-leaf display
d. pivot table
Question 2
Random samples of size 17 are taken from a population that has 200 elements, a mean of 36, and a standard deviation of 8 . Which of the following best describes the form of the sampling distribution of the sample mean for this situation?
a. Approximately normal because the sample size is small relative to the population size
b. Approximately normal because of the central limit theorem
c. Exactly normal
d. None of these alternatives is correct.

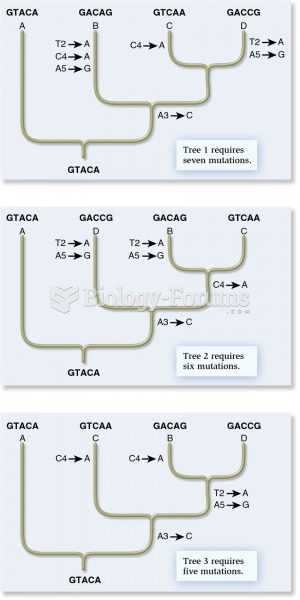 The cladistic approach from molecular genetic data
 These bumper stickers show an allegiance to New Age religions
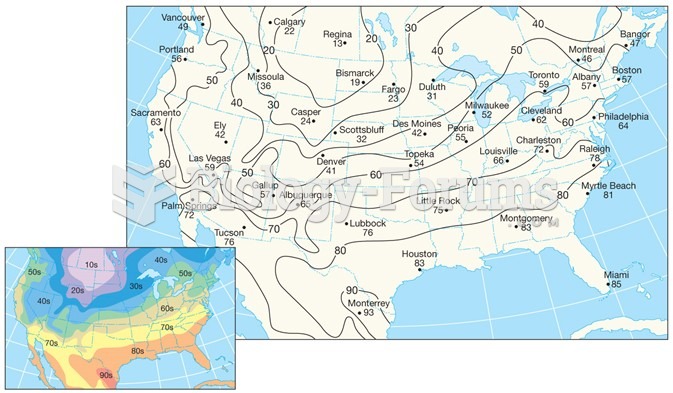 Air-Temperature Data
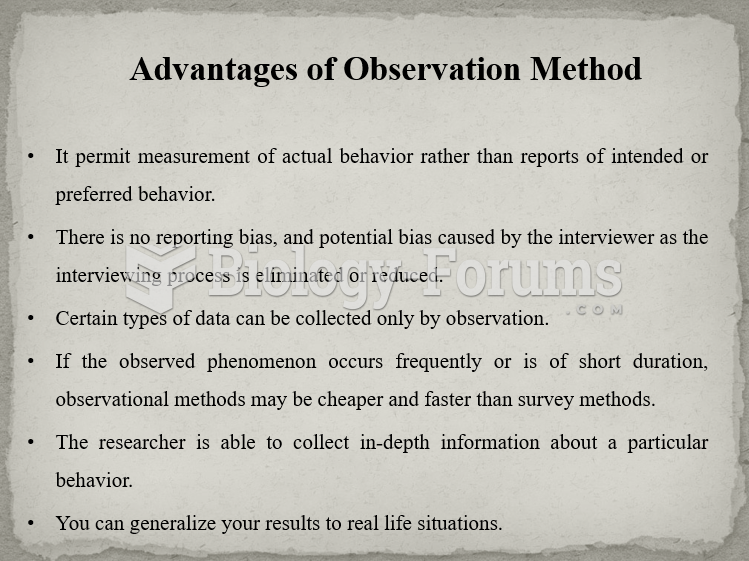 Advantages of Observational Method
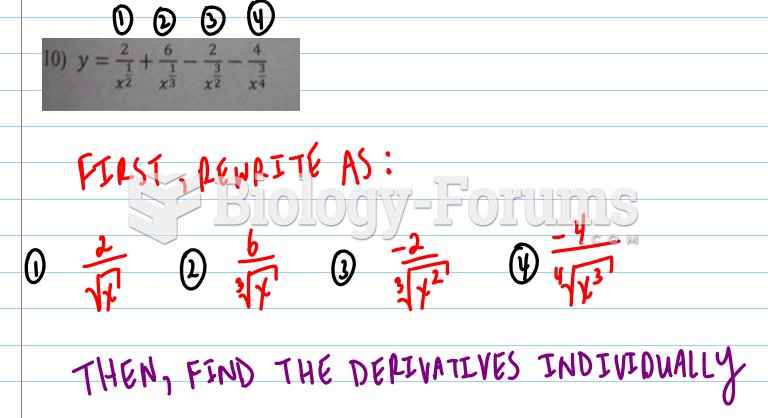 Delta method question
 Computer-automated DNA sequencing using the chain-termination (Sanger) method