This topic contains a solution. Click here to go to the answer
|
|
|

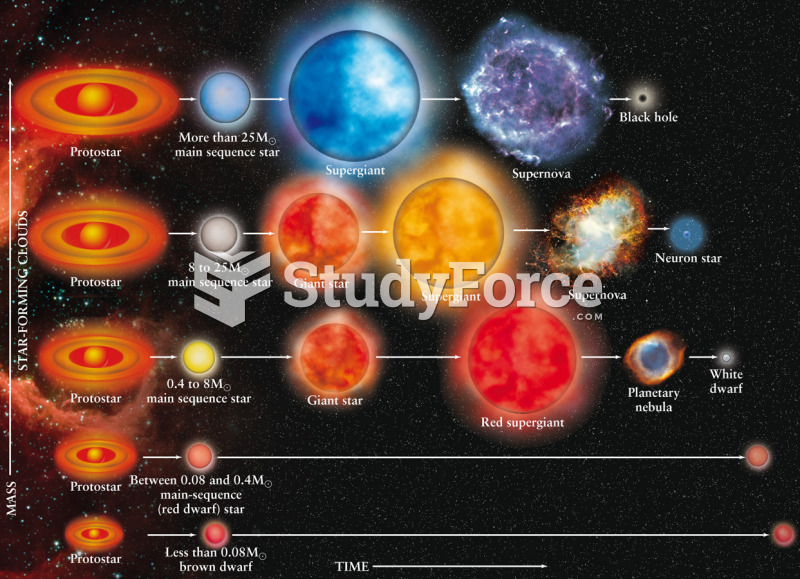 A Summary of Stellar Evolution
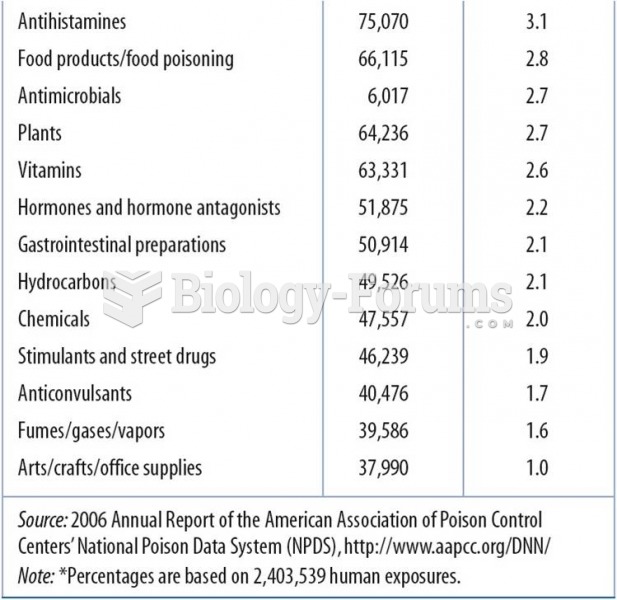 2006 Data:Top 25 Substances Involved in Human Exposures
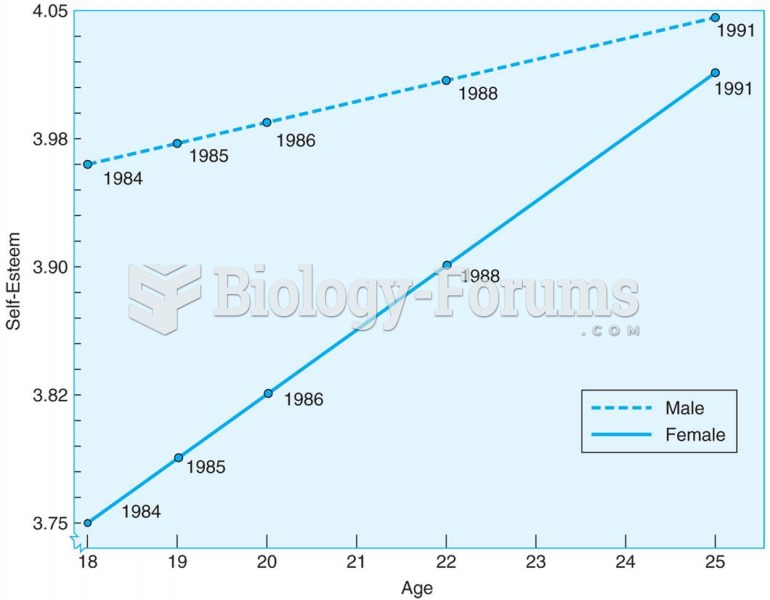 Young adults increase in self-esteem between the ages of 18 and 25, according to this longitudinal s
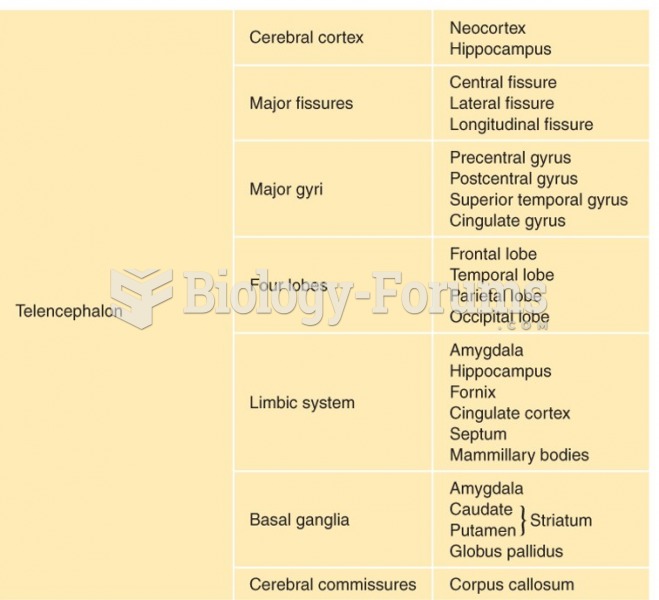 Summary of major brain structures.
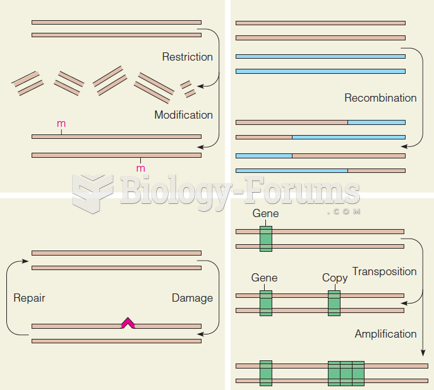 A summary of the major processes in information restructuring of DNA
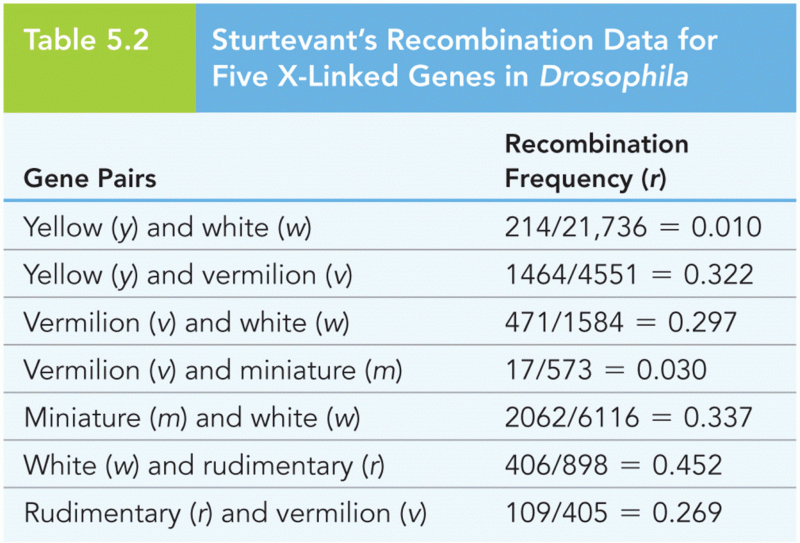 Sturtevant’s Recombination Data for Five X-Linked Genes in Drosophila