This topic contains a solution. Click here to go to the answer
|
|
|

 Methods to Document Peripheral Pulses A. Stick Figure Peripheral Pulse Documentation B. Tabular Peri
 The heme group is present in myoglobin, hemoglobin, and many other proteins
 assessment techniques
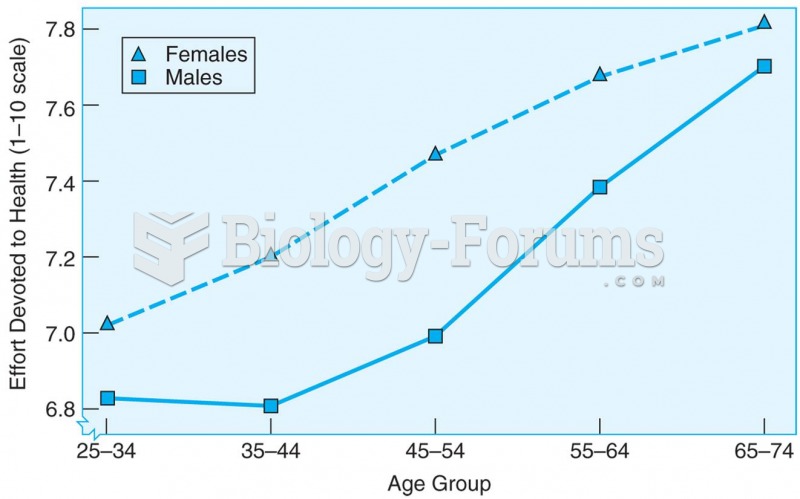 Cross-sectional data showing that the amount of effort spent on personal health care increases with
 Forms of Sexual Misconduct Cont
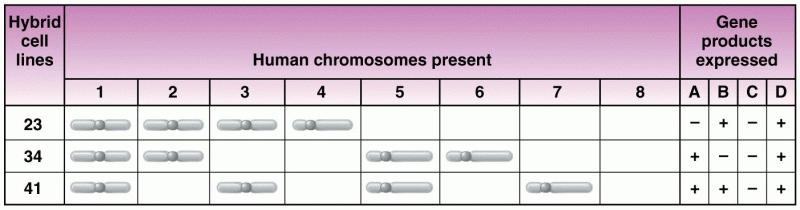 A hypothetical grid of data used in synteny testing