This topic contains a solution. Click here to go to the answer
|
|
|

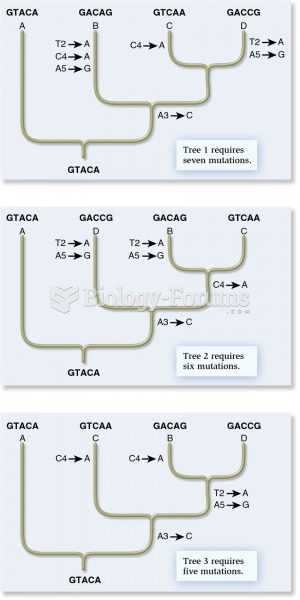 The cladistic approach from molecular genetic data
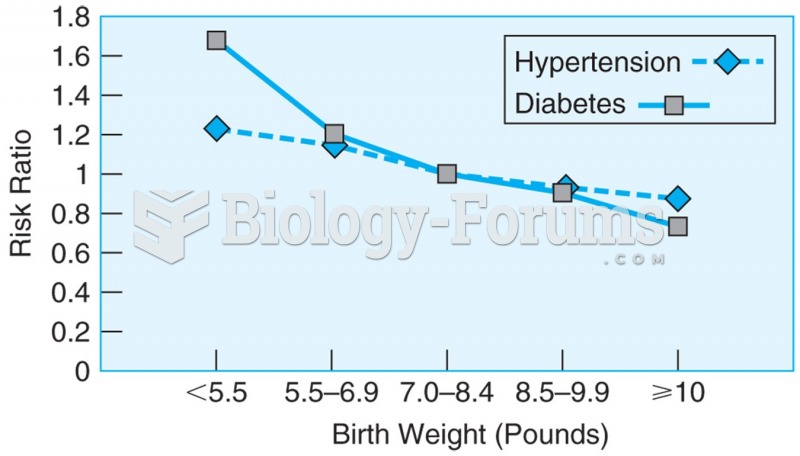 Data from more than 22,000 men over the age of 40, showing the relationship between birth weight and ...
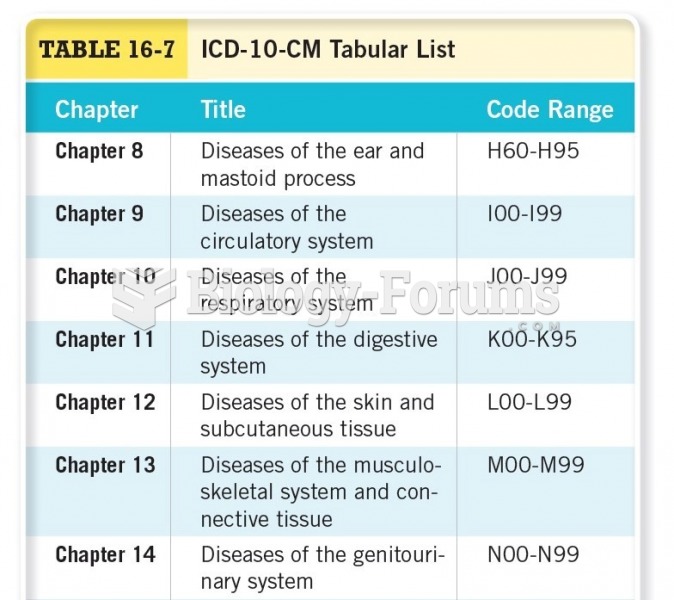 ICD-10-CM Tabular List
 Conventions and Techniques of Egyptian Pictorial Relief
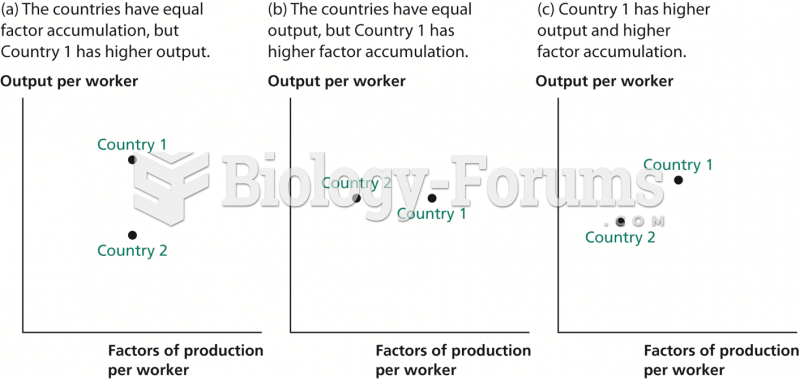 Inferring Productivity from Data on Output and Factor Accumulation
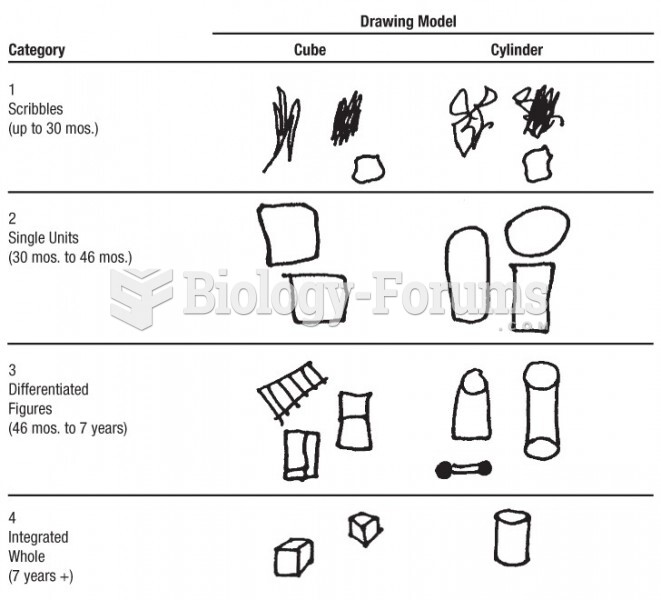 Examples of drawings in each category of two object forms