|
|
|

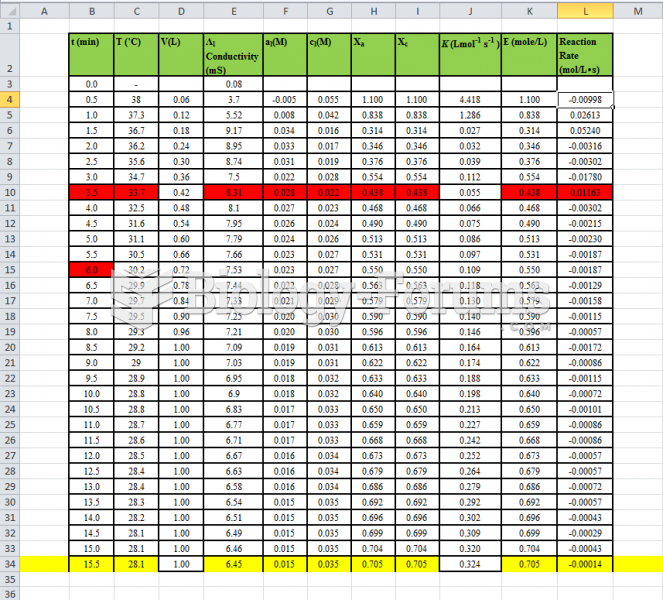 Fluidization - Data Table of experiment
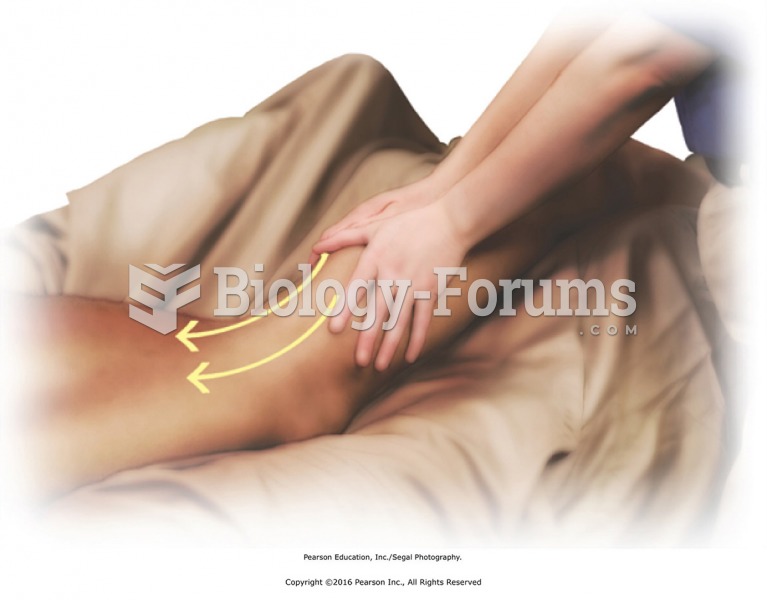 Stand at the side of the table facing the head. Apply lubricant with effleurage from ankle to hip ...
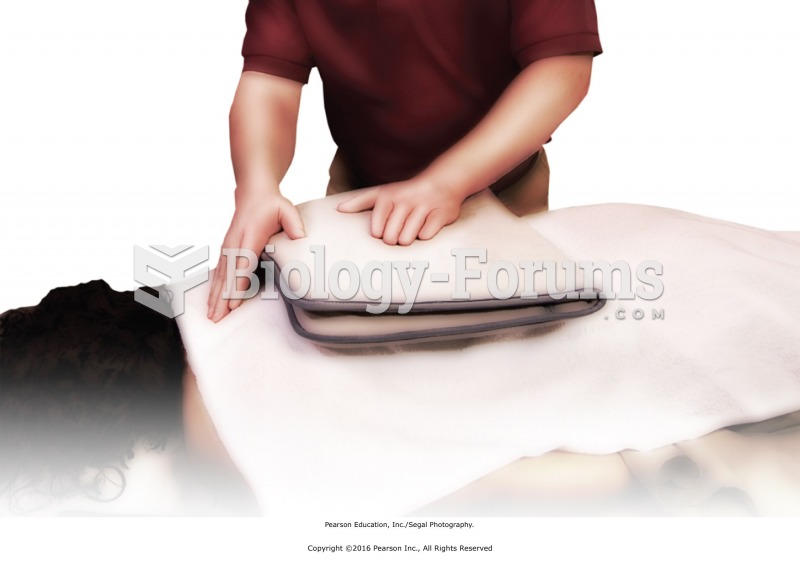 Apply the heat source, and ask for immediate feedback on the heat intensity felt by the recipient. ...
 Apply L stroke on terminus. Place your index and middle fingers on the left and right terminus; ...
 Basic Marketing Research: Using Microsoft Excel Data Analysis
 Analyzing texts