Did you know?
Before a vaccine is licensed in the USA, the Food and Drug Administration (FDA) reviews it for safety and effectiveness. The CDC then reviews all studies again, as well as the American Academy of Pediatrics and the American Academy of Family Physicians. Every lot of vaccine is tested before administration to the public, and the FDA regularly inspects vaccine manufacturers' facilities.
Did you know?
Certain chemicals, after ingestion, can be converted by the body into cyanide. Most of these chemicals have been removed from the market, but some old nail polish remover, solvents, and plastics manufacturing solutions can contain these substances.
Did you know?
Tobacco depletes the body of vitamins A, C, and E, which can result in any of the following: dry hair, dry skin, dry eyes, poor growth, night blindness, abscesses, insomnia, fatigue, reproductive system problems, sinusitis, pneumonia, frequent respiratory problems, skin disorders, weight loss, rickets, osteomalacia, nervousness, muscle spasms, leg cramps, extremity numbness, bone malformations, decayed teeth, difficulty in walking, irritability, restlessness, profuse sweating, increased uric acid (gout), joint damage, damaged red blood cells, destruction of nerves, infertility, miscarriage, and many types of cancer.
Did you know?
Acute bronchitis is an inflammation of the breathing tubes (bronchi), which causes increased mucus production and other changes. It is usually caused by bacteria or viruses, can be serious in people who have pulmonary or cardiac diseases, and can lead to pneumonia.

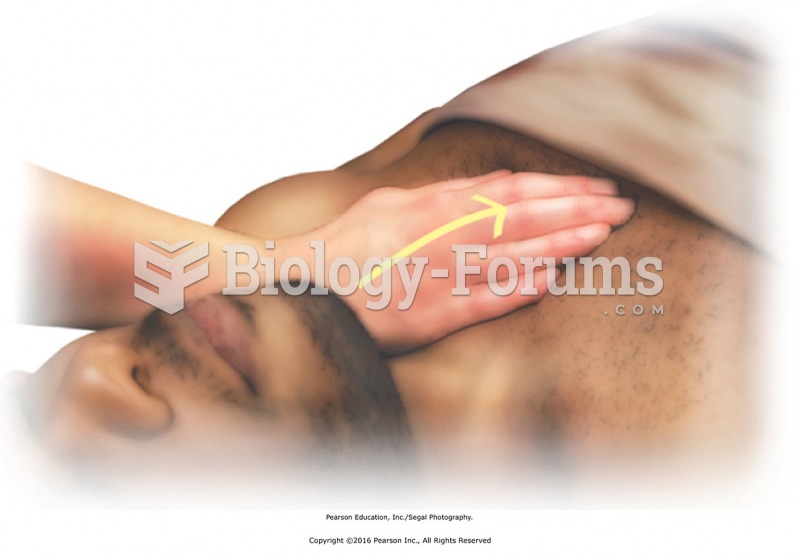 Effleurage over sternum. Apply with the palm of the hand between breast tissue. Omit this technique ...
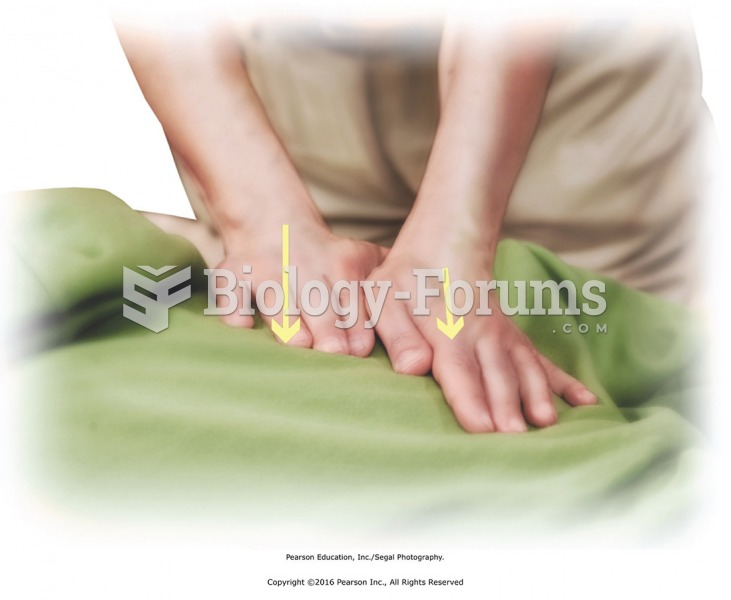 Apply palm compressions using both hands over the entire back and shoulder musculature.
 Locate and apply thumb pressure directly into suspected TrPs in upper trapezius.
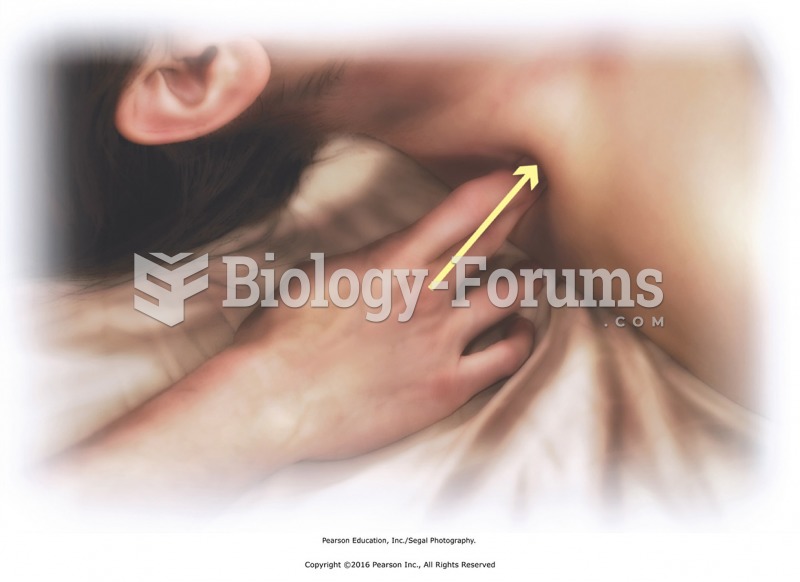
 Apply L stroke on terminus. Place your index and middle fingers on the left and right terminus; ...
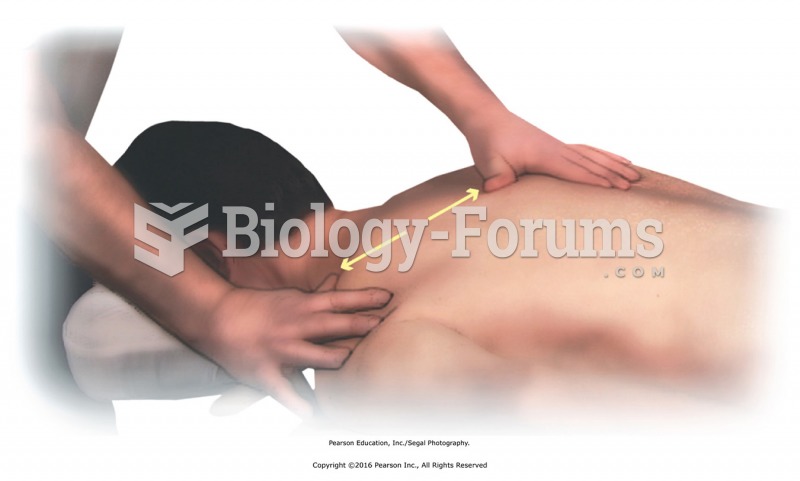 Stripping effleurage over the shoulder area. Use the thumbs sliding away from each other to apply a ...
 Data for Calculating Productivity Growth in Erewhon