|
|
|

 Vision with macular degeneration is experienced with an inability to focus in the center of the visu
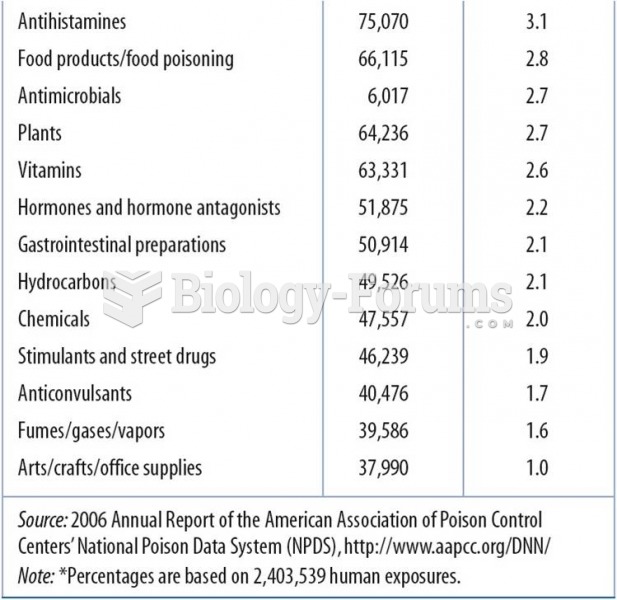 2006 Data:Top 25 Substances Involved in Human Exposures
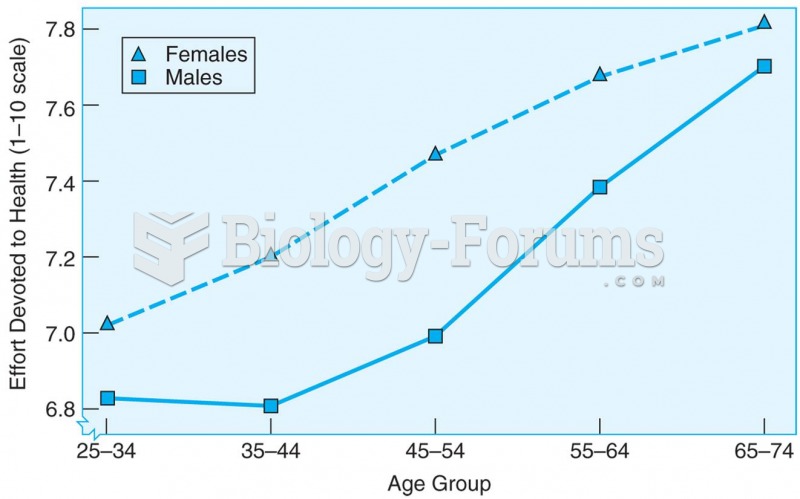 Cross-sectional data showing that the amount of effort spent on personal health care increases with
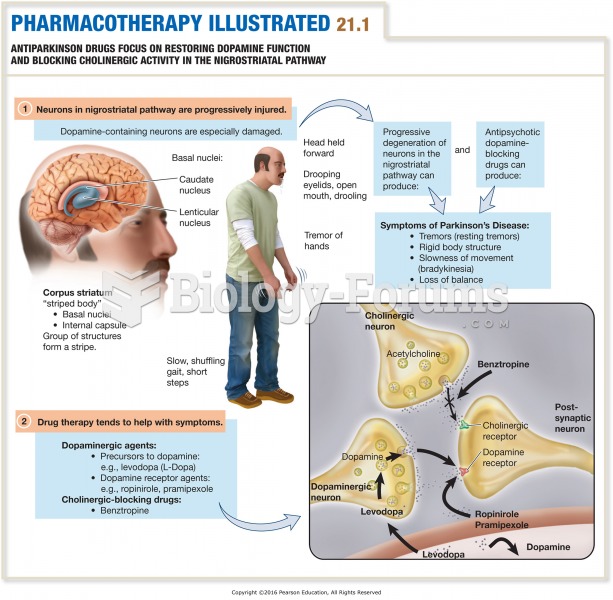 Antiparkinson Drugs Focus on Restoring Dopamine Function and Blocking Cholinergic Activity in the ...
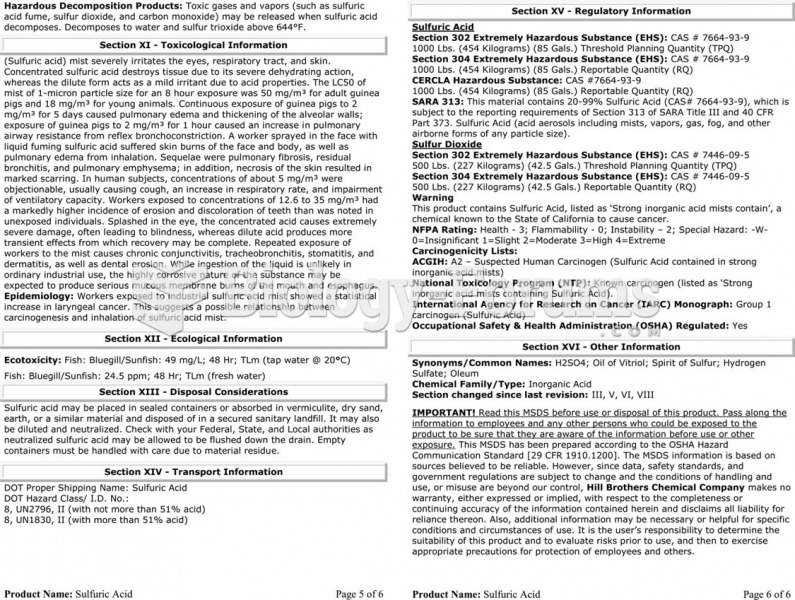 The material safety data sheet (MSDS) for sulfuric acid showing the detailed technical information ...
 How to calculate the mean for grouped data