This topic contains a solution. Click here to go to the answer
|
|
|

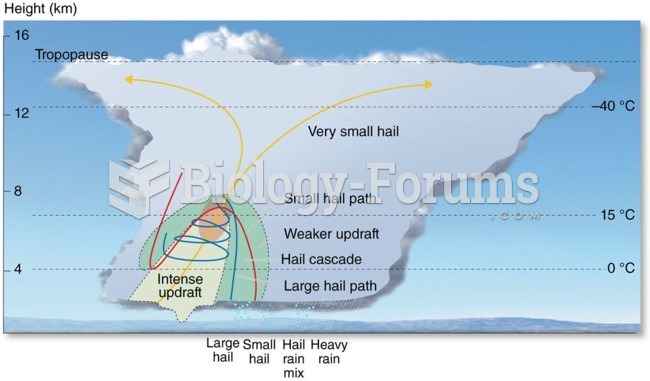 Distribution and Forms of Precipitation: Graupel and Hail
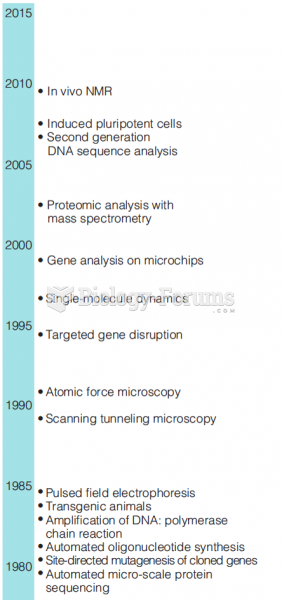 Recent history of biochemistry shown by the introduction of new techniques. (part 2)
 How to calculate present value (Question 2)
 Simple Decorating Techniques: Cake comb
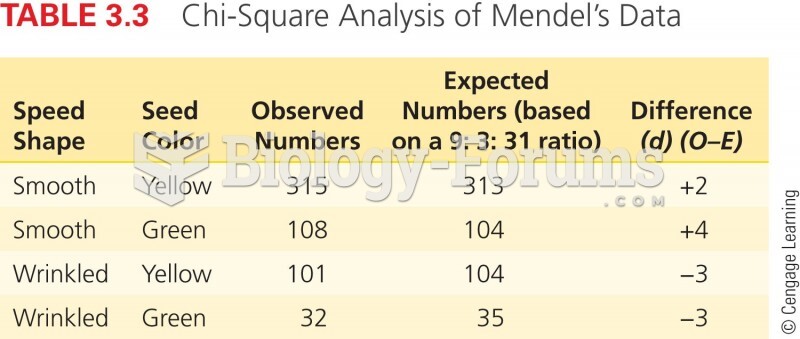 Chi-Square Analysis of Mendel's Data
 Sturtevant’s Recombination Data for Five X-Linked Genes in Drosophila