A histogram is
a. a graphical presentation of a frequency or relative frequency distribution.
b. a graphical method of presenting a cumulative frequency or a cumulative relative frequency distribution.
c. the history of data elements.
d. the same as a pie chart.
Question 2
All of the following are true about a cyclical pattern except
a. It is often due to multiyear business cycles.
b. It is often combined with long-term trend patterns and called trend-cycle patterns.
c. It usually is easier to forecast than a seasonal pattern due to less variability.
d. It is an alternating sequence of data points above and below the trend line.

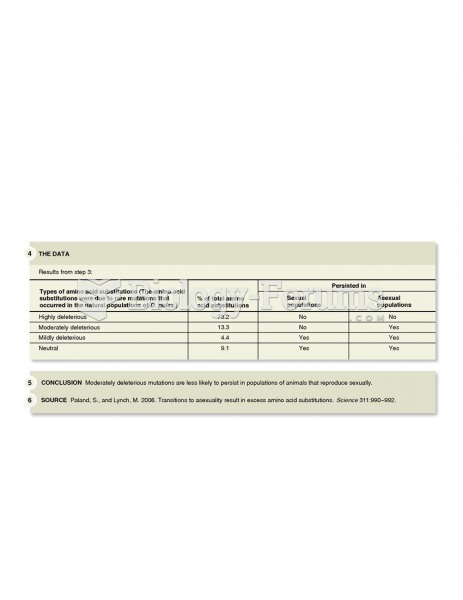 Paland and Lynch demonstrated the importance of sexual reproduction in reducing the frequency of mal
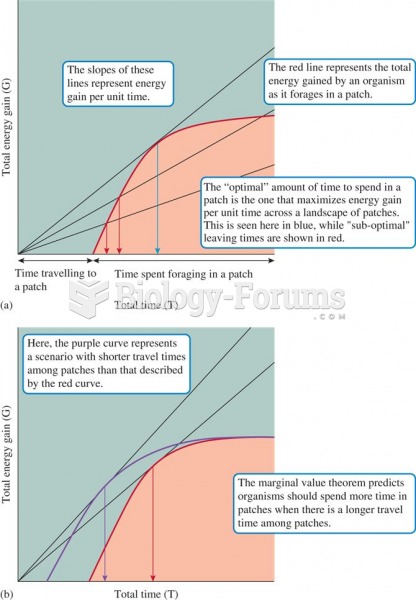 A graphical representation of the marginal value theorem.
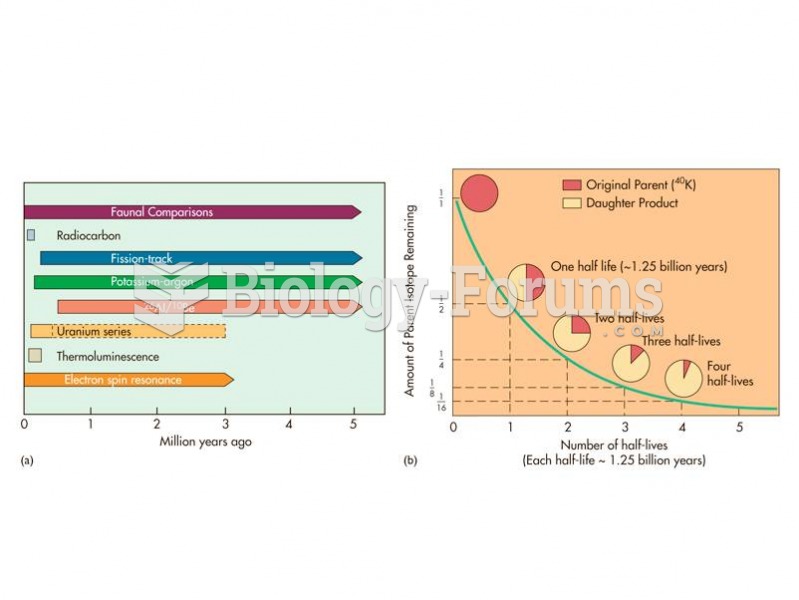 (a) The relative age ranges of different dating techniques depend upon the half-life of the system u
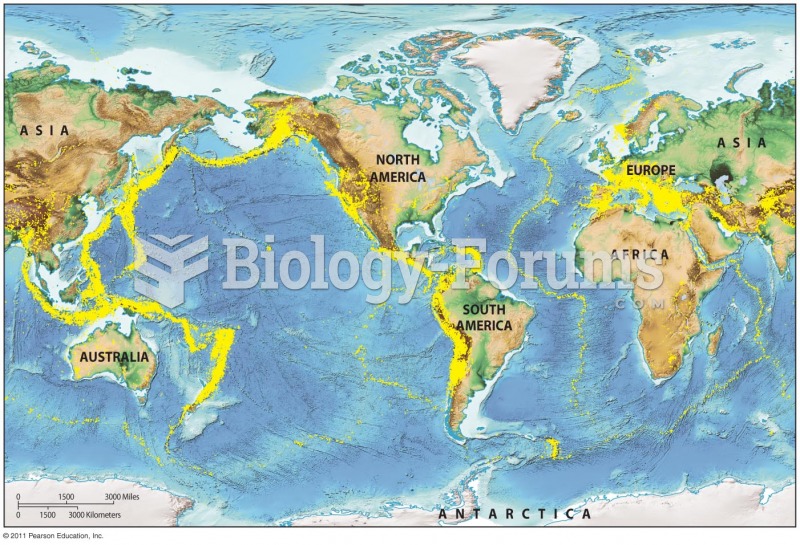 Global Distribution of Earthquakes
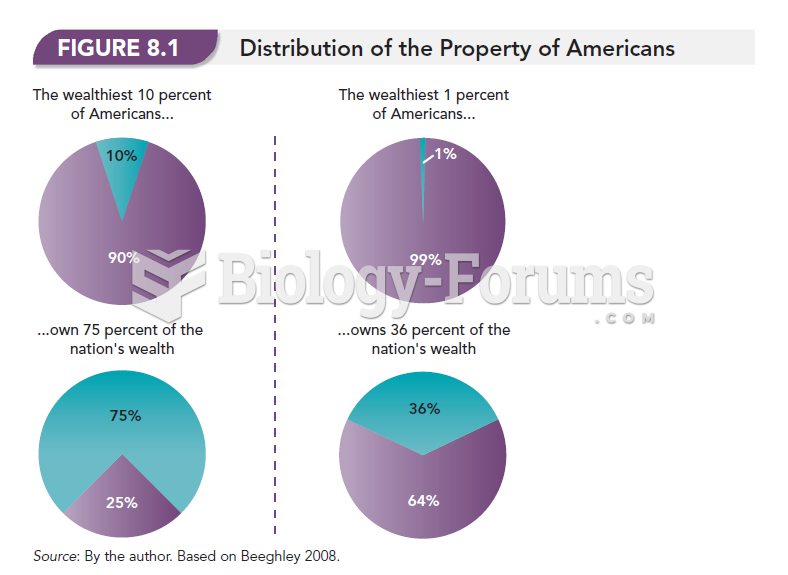 Distribution of the Property of Americans
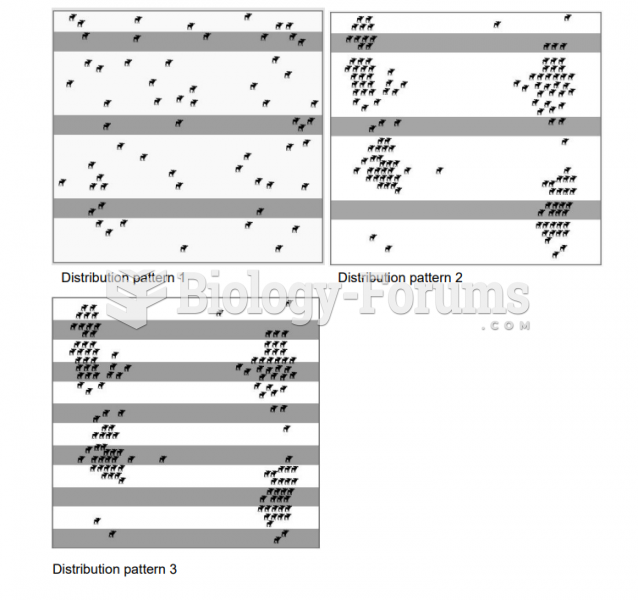 Distribution Patterns and Population Size Estimates (Bio 30)