A histogram is
a. a graphical presentation of a frequency or relative frequency distribution.
b. a graphical method of presenting a cumulative frequency or a cumulative relative frequency distribution.
c. the history of data elements.
d. the same as a pie chart.
Question 2
All of the following are true about a cyclical pattern except
a. It is often due to multiyear business cycles.
b. It is often combined with long-term trend patterns and called trend-cycle patterns.
c. It usually is easier to forecast than a seasonal pattern due to less variability.
d. It is an alternating sequence of data points above and below the trend line.

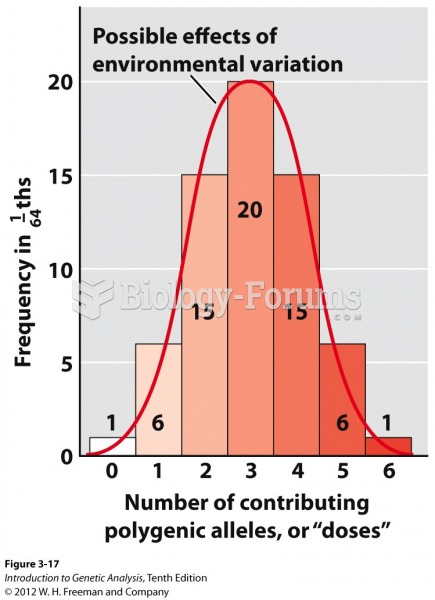 Histogram of polygenes from a trihybrid self
 POWER POINT PRESENTATION logo
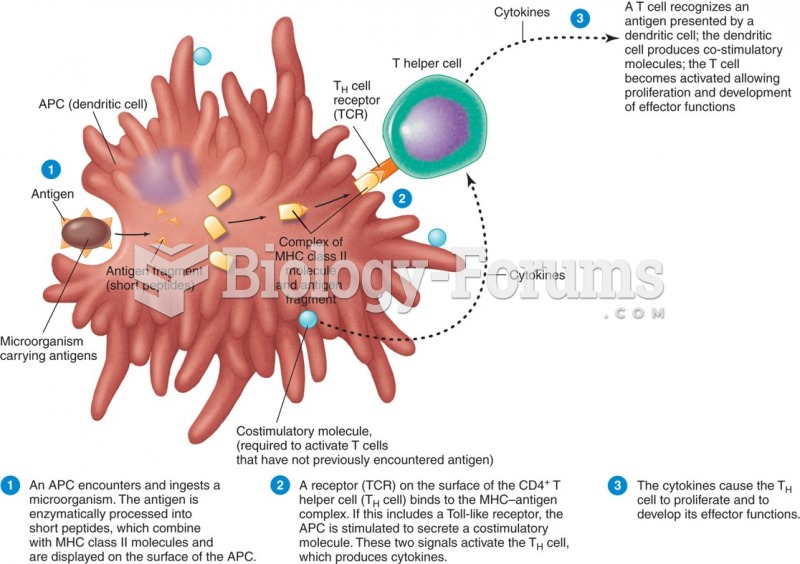 Antigen presentation to a T cell.
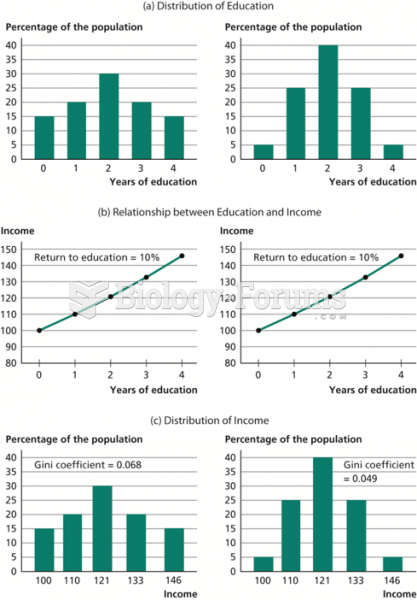 How the Distribution of Education Affects the Distribution of Income
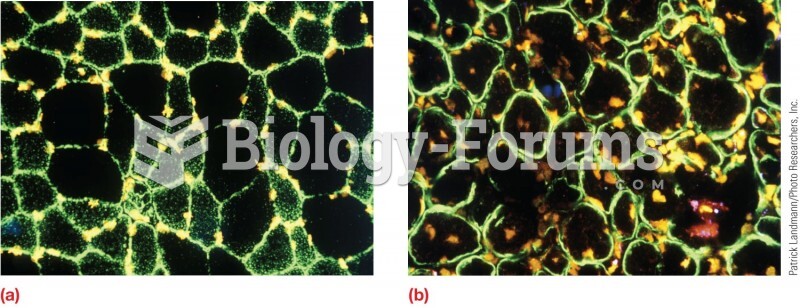 Distribution of dystrophin in muscle cells. (a) In normal muscle cells, all the dystrophin is locate
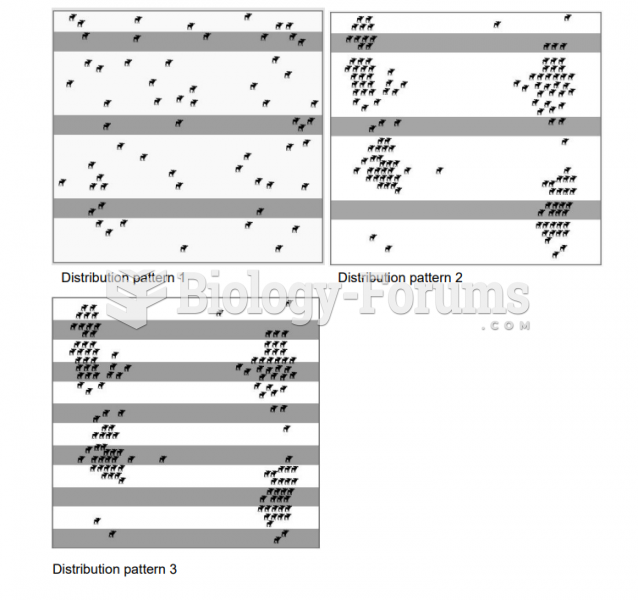 Distribution Patterns and Population Size Estimates (Bio 30)