|
|
|

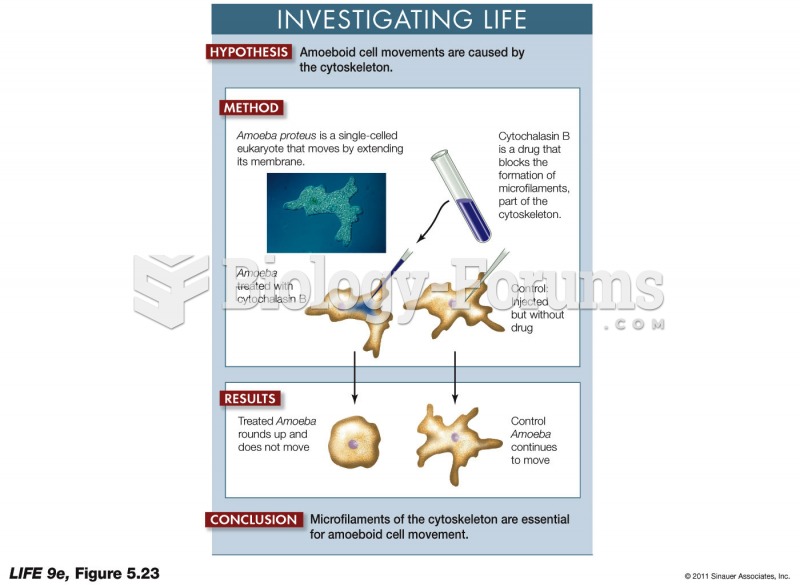 The Role of Microfilaments in Cell Movement-Showing Cause and Effect in Biology
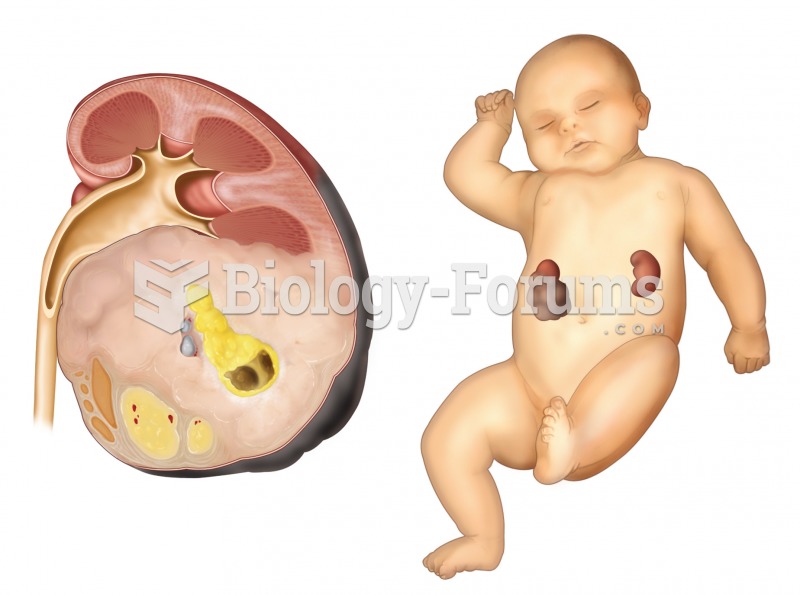 Nephroblastoma. A sectioned kidney reveals the presence of a very large tumor, which arose from feta
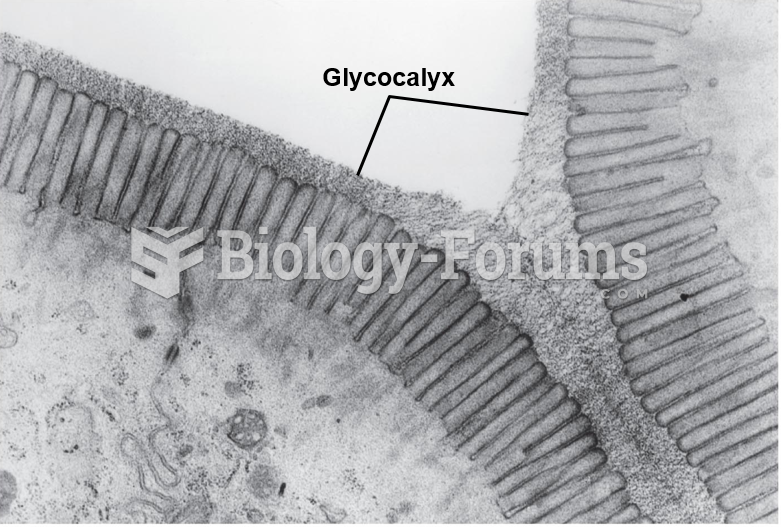 Electron micrograph of the plasma membranes of two cells showing the glycocalyx.
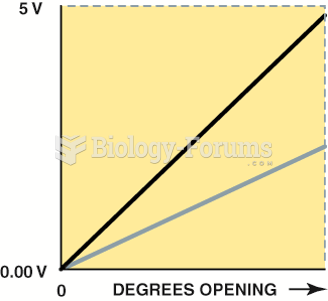 A typical accelerator pedal position (APP) sensor, showing two different output voltage signals ...
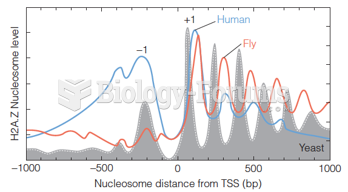 Distribution of H2A.Z-containing nucleosomes near a transcription start site (TSS)
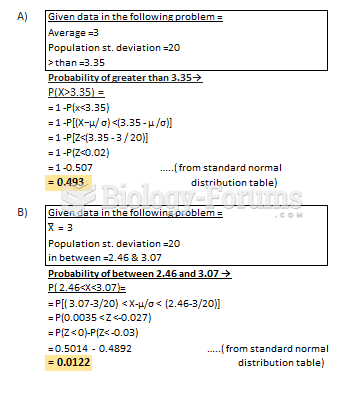 The time at which the mailman delivers the mail to Ace Bike Shop follows a normal distribution ...