This topic contains a solution. Click here to go to the answer
|
|
|

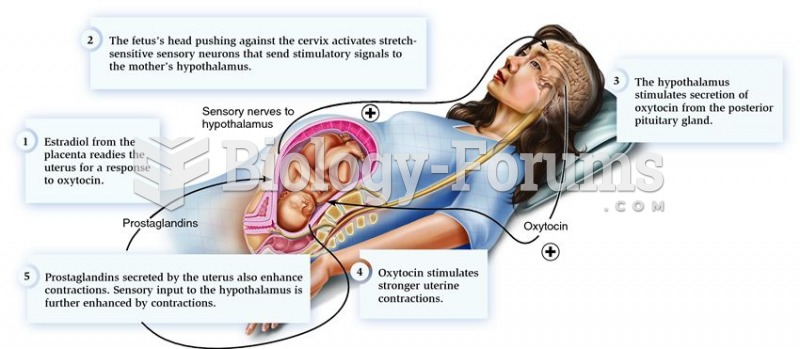 Hormonal control of parturition.
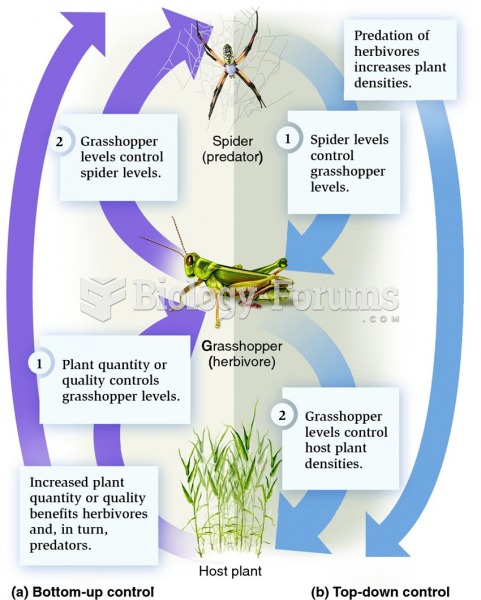 Bottom-up control versus top-down control.
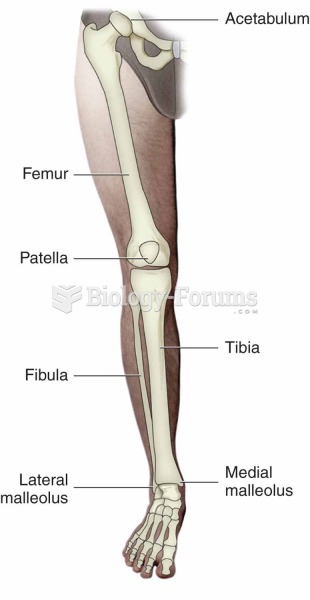 Bones of the lower extremity.
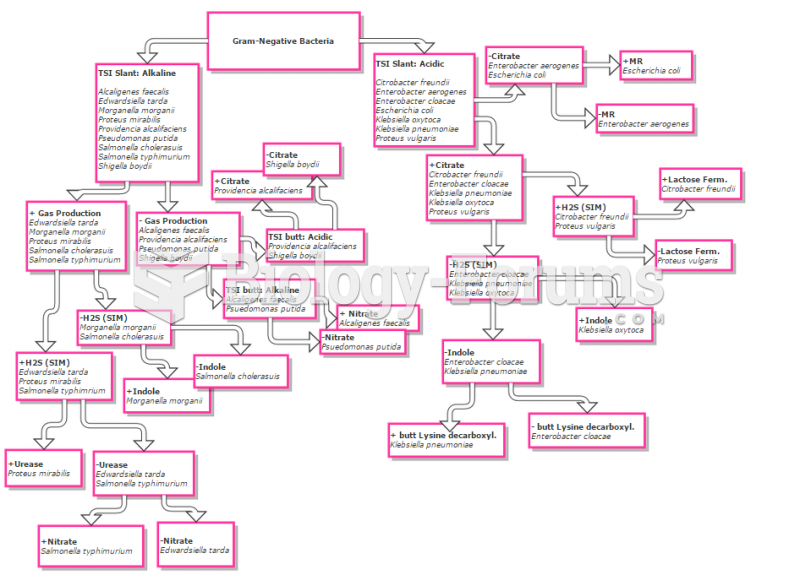 Gram negative flowchart
 Experimental demonstration of respiratory control
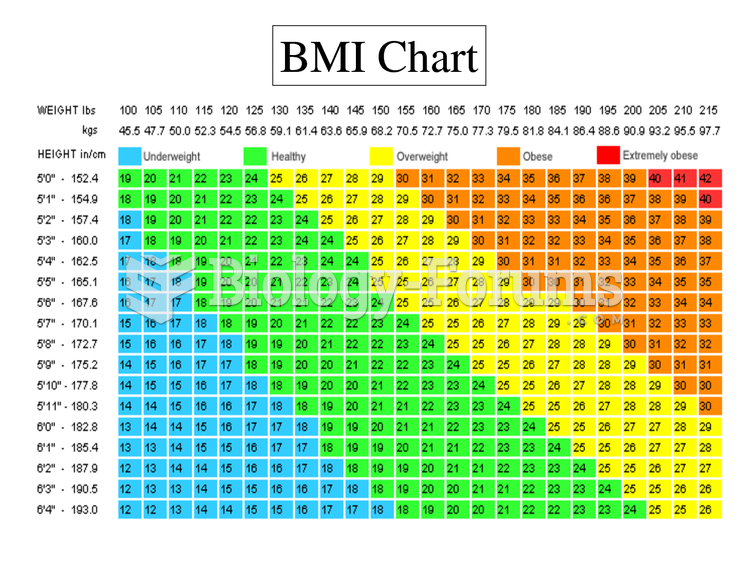 BMI Chart Weight Chart