|
|
|

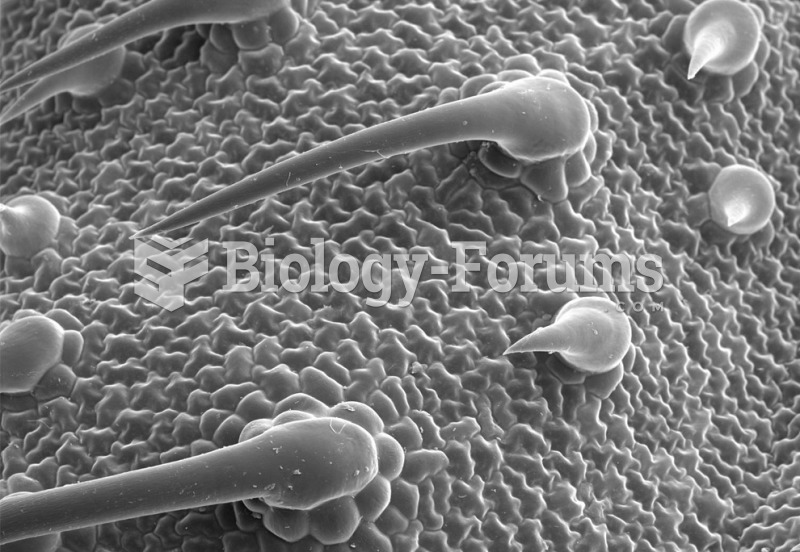 Heliotropium (marine heliotrope) lower leaf surface, showing trichomes and a few stomata
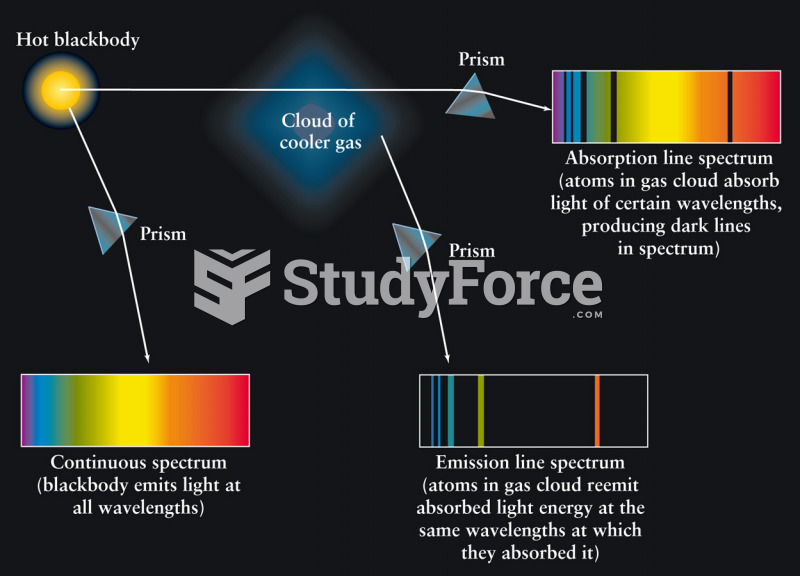 Continuous, Absorption Line, and Emission Line Spectra
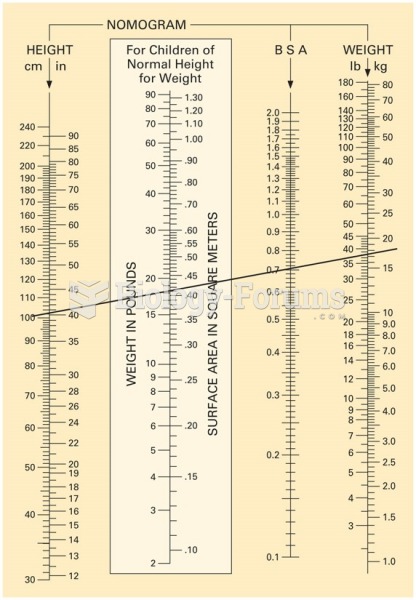 Nomogram chart. This example shows a line drawn from a child’s height of 100 cm to his weight, 35 ...
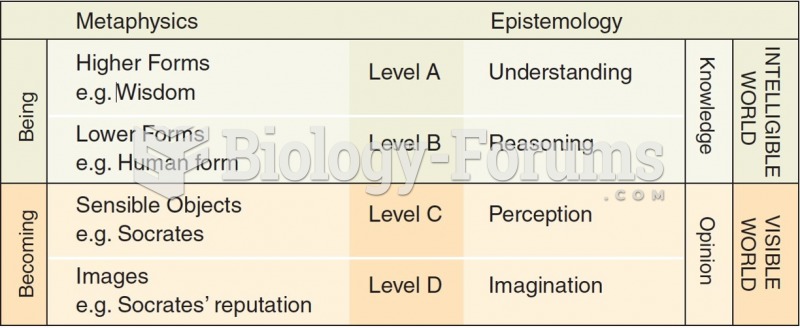 Plato’s Divided Line
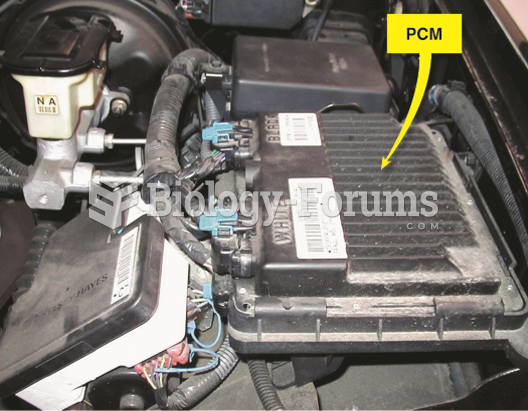 This Powertrain Control Module (PCM) is located under the hood on this Chevrolet pickup truck.
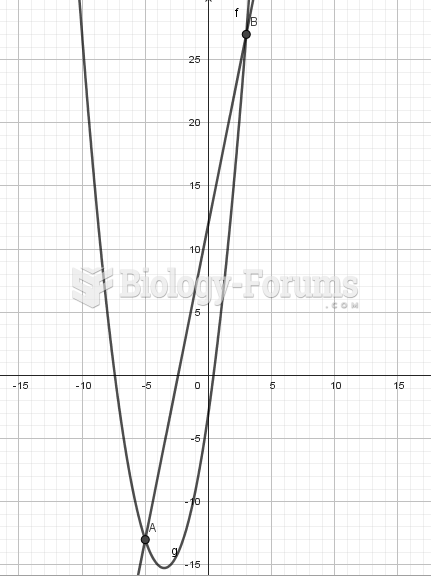 The line with the equation y=5x+12 intersects the parabola with equation y=xsqared+7x-3 at the ...