|
|
|

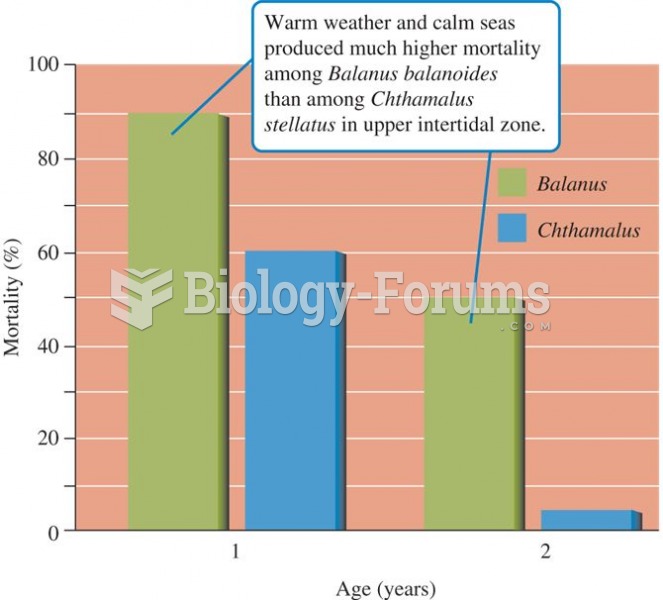 Barnacle mortality in the upper intertidal zone
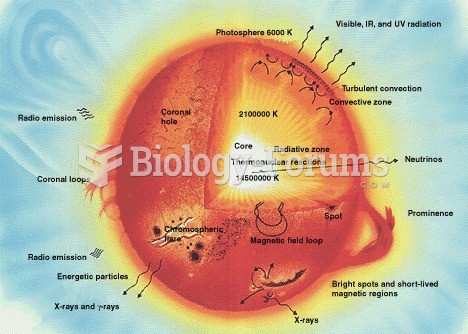 Internal structures of main sequence stars, convection zones with arrowed cycles and radiative zones
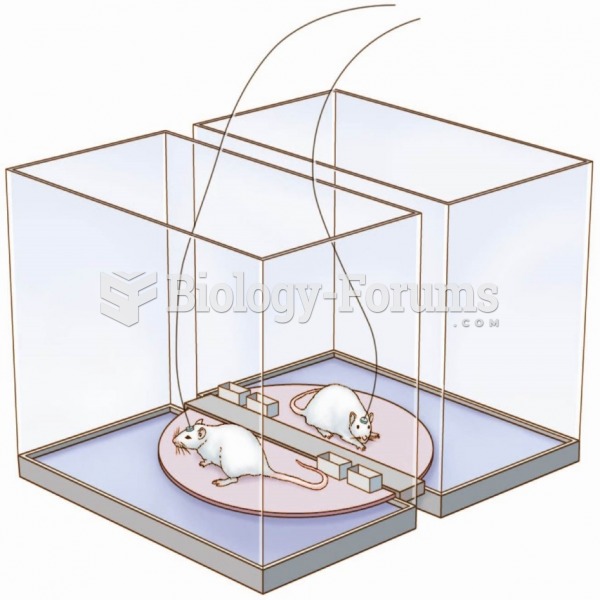 The carousel apparatus used to deprive an experimental rat of sleep while a yoked control rat is ...
 Holding the head with one hand, apply effleurage to upper trapezius on one side using the fist. When ...
 Cat paw mobilizing of shoulders toward the feet. Press downward along upper trapezius muscle from ...
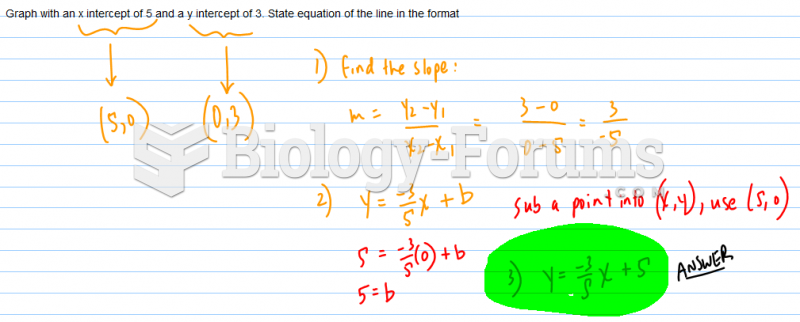 Finding the equation of a line