This topic contains a solution. Click here to go to the answer
|
|
|

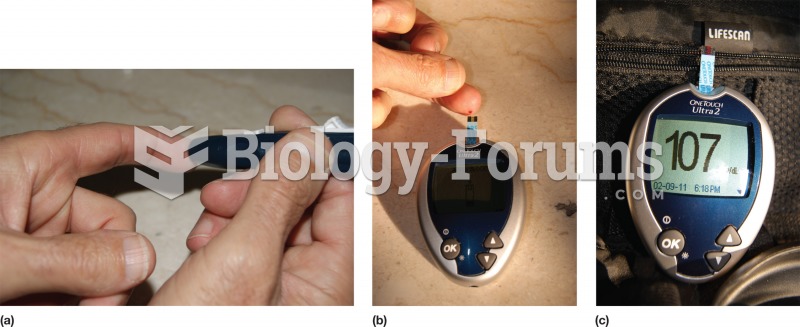 Blood glucose measurement. A postprandial test may be self-administered. (a) A lance pierces the ski
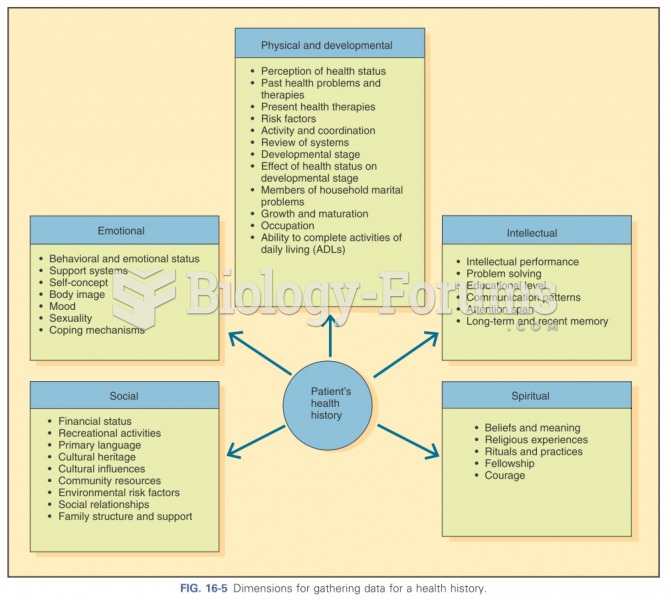 Dimensions for gathering data
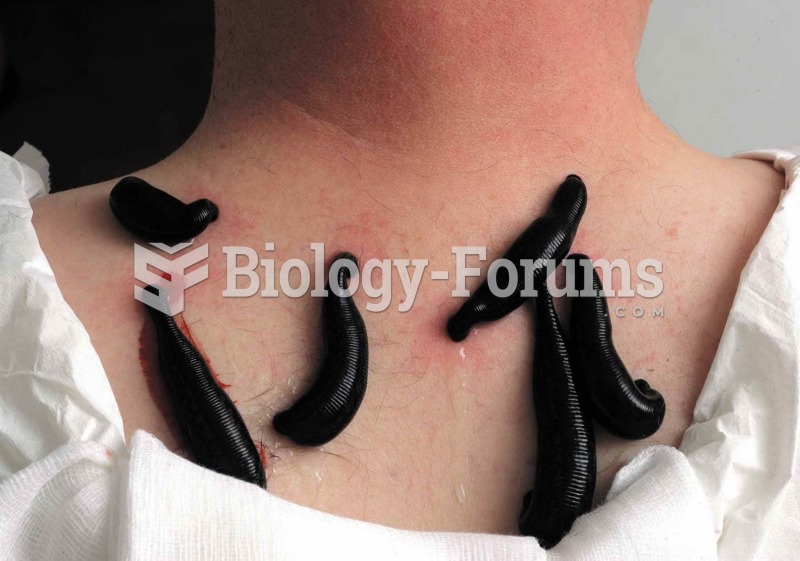 Medicinal leeches on a patient’s neck. Today leeches are sometimes used in microsurgery to prevent b
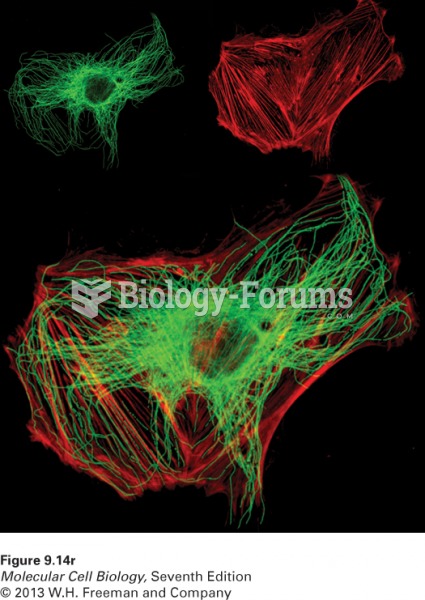 Double-label fluorescence microscopy can visualize the relative distributions of
 A physician uses a portable electronic tablet to enter patient data while in the examination room.
 Sample hypnograms of children, young adults, and older adults