This topic contains a solution. Click here to go to the answer
|
|
|

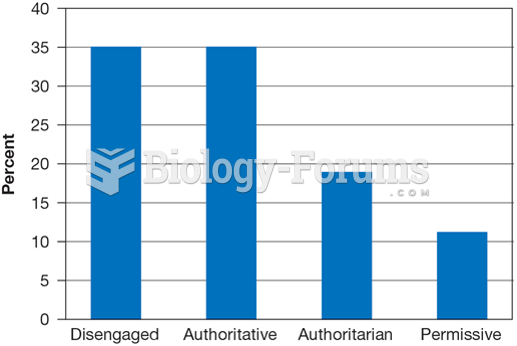 Parenting Styles Reported by a Representative Sample of American Adolescents
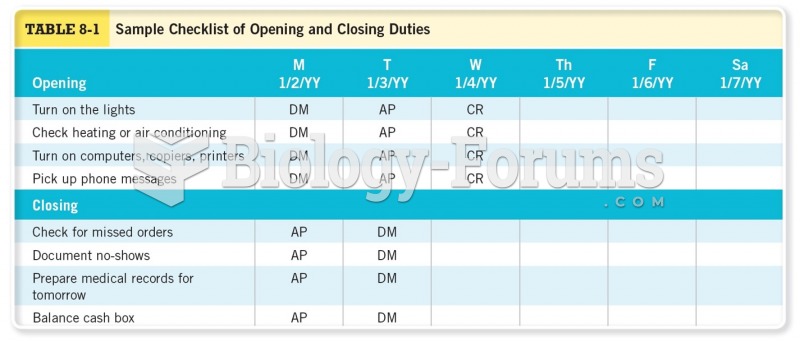 Sample Checklist of Opening and Closing Duties
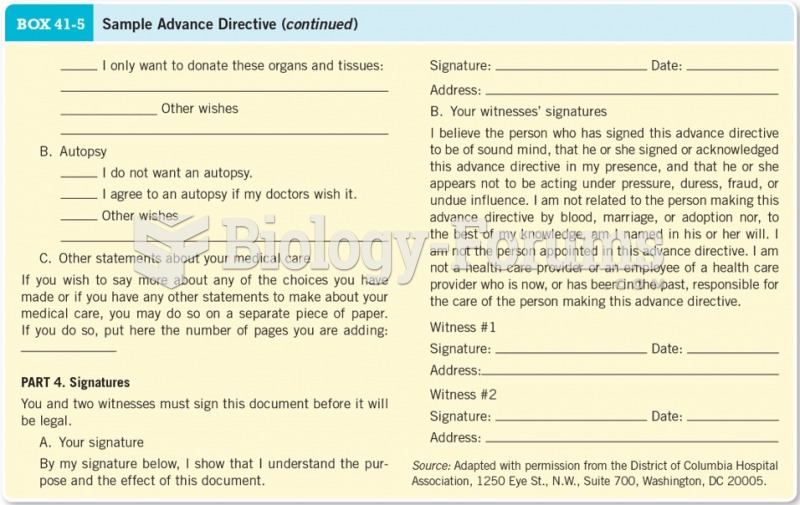 Sample Advance Directive Cont.
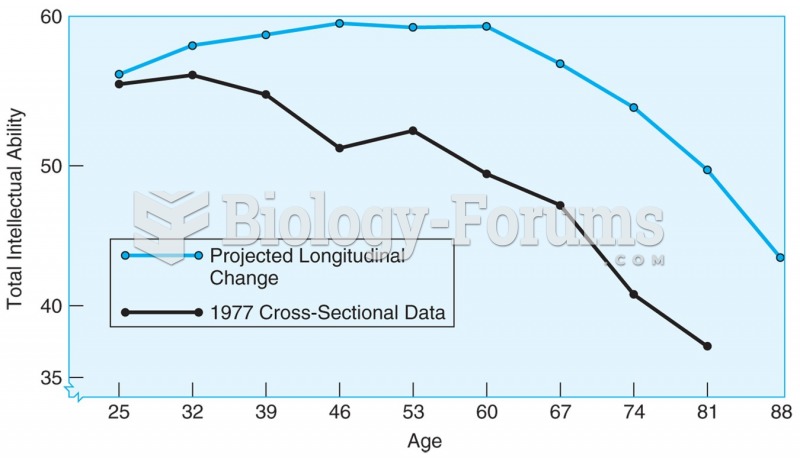 4.1 Age changes in total IQ based on cross-sectional data (lower line) and longitudinal data ...
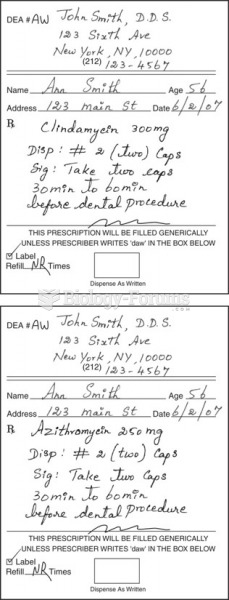 Sample prescriptions of antibiotics for prophylaxis against infective endocarditis.
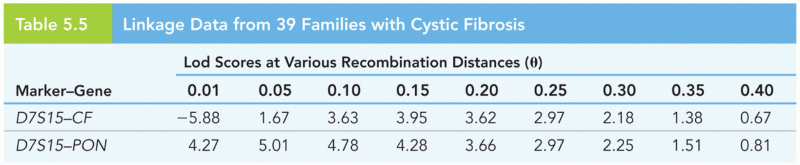 Linkage Data from 39 Families with Cystic Fibrosis