This topic contains a solution. Click here to go to the answer
|
|
|

 Acquiring Weather Data
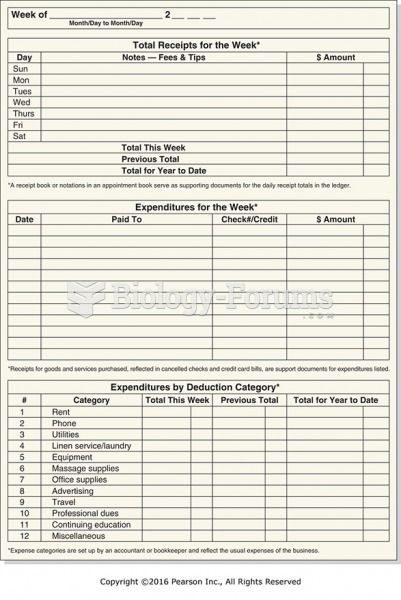 Sample of a weekly bookkeeping ledger.
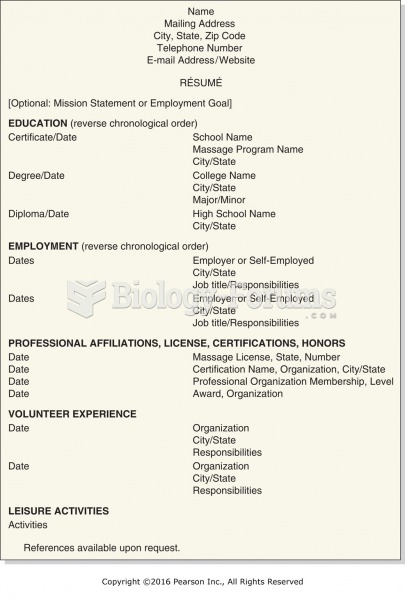 Sample of résumé content.
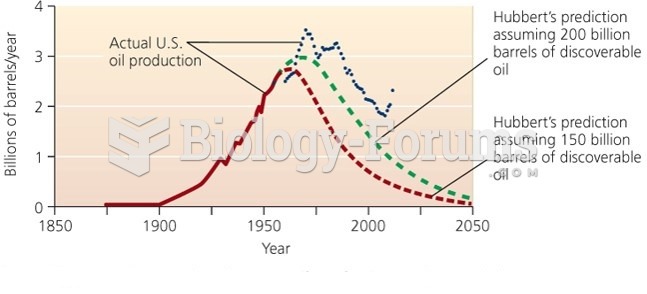 Hubbard’s Predication of Peak in U.S Oil Production with Actual Data
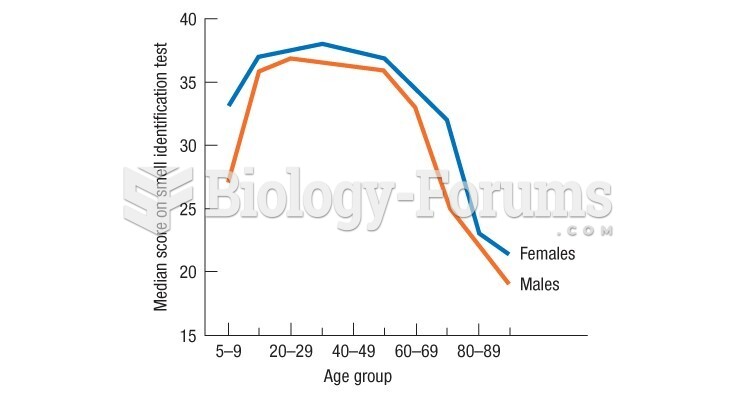 Doty's data show a very rapid drop in late adulthood in the ability to identify smells
 Linkage Data from 39 Families with Cystic Fibrosis