This topic contains a solution. Click here to go to the answer
|
|
|

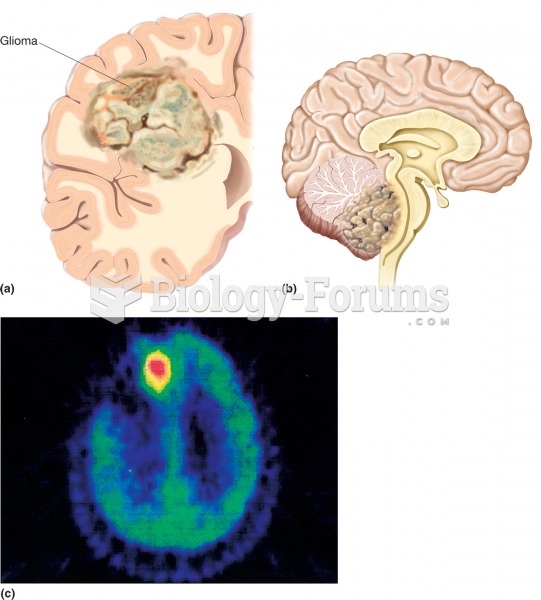 Glioma. (a) Illustration of a large glioma (colored area) within the left cerebral hemisphere in a s
 The frontal lobe (green) bounded by the Sylvian fissure (yellow line) and central sulcus (red line),
 Mold is growing on red/green agar in a divided Petri dish.
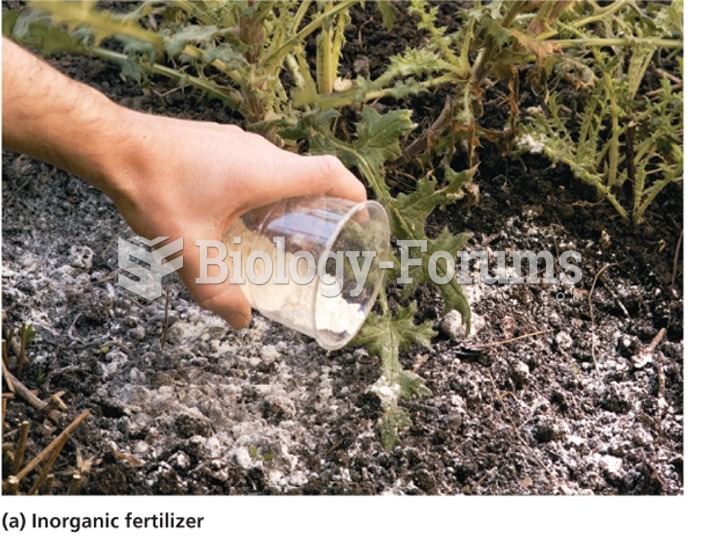 The Green Revolution and Fertilizer Impacts
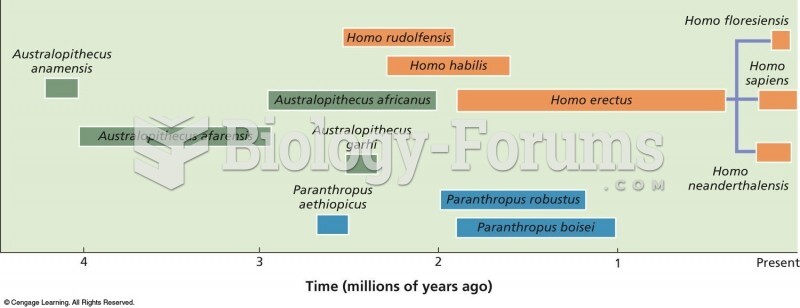 Estimates of the dates of origin and extinction of the three main groups of hominins (green, blue, a
 A female Agile Wallaby (Macropus agilis) with young in pouch feeds on grass in Green Bowling Bay Nat